किसी प्रतियोगिता परीक्षा में विभिन्न राज्यों से विभिन्न संकायों में सम्मिलित तथा उत्तीर्ण छात्रों की संख्या
 A= कला C= वाणिज्य S= विज्ञानं E= अभियंत्रण Ag= कृषि Ap= सम्मिलित Q= उत्तीर्ण
किस राज्य में विज्ञानं संकाय में उत्तीर्ण छात्रों का प्रतिशत न्यूनतम है ?
आंध्र प्रदेश
उत्तर प्रदेश
प० बंगाल
केरल
The correct Answer is:C
Step by step video & image solution for किसी प्रतियोगिता परीक्षा में विभिन्न राज्यों से विभिन्न संकायों में सम्मिलित तथा उत्तीर्ण छात्रों की संख्या A= कला C= वाणिज्य S= विज्ञानं E= अभियंत्रण Ag= कृषि Ap= सम्मिलित Q= उत्तीर्ण किस राज्य में विज्ञानं संकाय में उत्तीर्ण छात्रों का प्रतिशत न्यूनतम है ? by Maths experts to help you in doubts & scoring excellent marks in Class 14 exams.
Updated on:21/07/2023Topper's Solved these Questions
- सारणीकरण BOOK - MAHESH MISHRACHAPTER - सारणीकरण EXERCISE - प्रतियोगी परीक्षाओ हेतु अभ्यास प्रश्नमाला
73 Videos
- सारणीकरण BOOK - MAHESH MISHRACHAPTER - सारणीकरण EXERCISE - प्रतियोगी परीक्षाओ हेतु अभ्यास प्रश्नमाला
73 Videos
- साधारण ब्याज BOOK - MAHESH MISHRACHAPTER - साधारण ब्याज EXERCISE - 9C प्रतियोगी परीक्षाओ में पूछे गए प्रश्न
65 Videos
Similar Questions
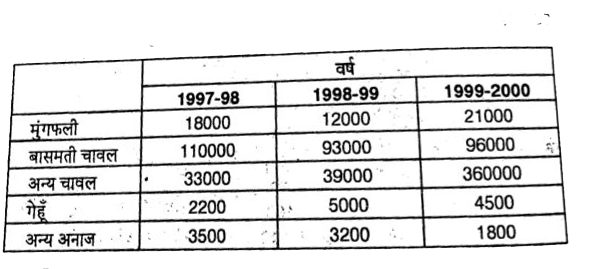
निम्नलिखित प्रत्येक सरणी को पढ़िए और उसके नीचे दिए गए प्रश्नो का उत्तर दीजिये।

किस भोज्य उत्पाद का निर्यात पहले दो लगातार वर्षो में उसके कुल निर्यात के दो गुना से भी अधिक है ?
View Solutionनिम्नलिखित प्रत्येक सरणी को पढ़िए और उसके नीचे दिए गए प्रश्नो का उत्तर दीजिये।

किस भोज्य उत्पाद का निर्यात पहले दो लगातार वर्षो में उसके कुल निर्यात के दो गुना से भी अधिक है ?
View Solution400 रु. को राशि पर 5% वार्षिक दर से 73 दिनों का साधारण ब्याज क्या होगा ?
View SolutionDetermine the point of symmetry of a regular hexagon.
View SolutionMatch the following Column A to Column B

View SolutionMatch the following Column A to Column B

View SolutionMatch the following Column A to Column B

View SolutionThe inequation represented by the graph given below is :
View SolutionThe inequation that best describes the graph given below is _________
View SolutionThe inequation that best describes the following graph is _________
View Solution(##ARH_HIN_ASP_JEE_MN_CHE_XII_C11_E02_159_Q01.png" width="80%">
उपरोक्त अभिक्रिया में सम्मिलित इलेक्ट्रोनस्नेहि है
View SolutionStudy the pie-chart and answer the questions: Break up (degree wise) of students in terms of specialization in different areas(A, B, C, D & E) in an MBA program. The number of students specialising in E is what percent more than that of students specialising in C? पाई-चार्ट का अध्ययन करें और प्रश्नों के उत्तर दें: एमबीए प्रोग्राम में विभिन्न क्षेत्रों (ए, बी, सी, डी एंड ई) में विशेषज्ञता के मामले में छात्रों का ब्रेक अप (डिग्री वार)। E में विशेषज्ञता प्राप्त छात्रों की संख्या C में विशेषज्ञता वाले छात्रों से कितने प्रतिशत अधिक है?
View SolutionThis table shows the number of students studying in various streams in different colleges. निम्नलिखित तालिका पांच कॉलेजों के तीन विषयों में पढ़ने वाले छात्रों की संख्या दर्शाती है | The number of students in the science stream of college C is approximately what percentage of students studying in that college? कॉलेज C में विज्ञान विषय में छात्रों की संख्या उस कॉलेज में पढ़ने वाले छात्रों की संख्या का लगभग कितना प्रतिशत है ?
View SolutionIn the given bar graph, the percentage decrease in the number of students in Institute A in 2016 is what percent of students in 2015. इस दंड आरेख में संस्थान A में 2016 में छात्रों की संख्या में प्रतिशत कमी 2015 के छात्रों की संख्या का क्या प्रतिशत है ?
View SolutionIn a particular year, the number of students enrolled in different streams in a college is as follows:
एक विशेष वर्ष में, किसी कॉलेज के विभिन्न विषयों में नामांकित छात्रों की संख्या इस प्रकार है : The percentage of girl students is:
छात्राओं का प्रतिशत है :
View SolutionThe given pie chart shows the percentage of students enrolled for the courses A, B, C, D and E in a university and the table shows the percentage of students that passed, out of the enrolled students.
दिया गया पाई चार्ट एक विश्वविद्यालय में पाठ्यक्रम A, B, C, D और E के लिए नामांकित छात्रों के प्रतिशत को दर्शाता है और तालिका उन छात्रों का प्रतिशत दिखाती है, जो नामांकित छात्रों में से उत्तीर्ण हुए हैं।
 If the total number of students is 60000, then the total number of students who did not pass in the
courses A, C is:
यदि छात्रों की कुल संख्या 60000 है, तो कुल छात्रों की संख्या, जो पाठ्यक्रम A, C में उत्तीर्ण नहीं हुए हैं:
View Solution
