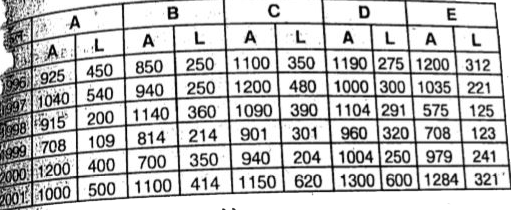
विभिन्न वर्षो में पांच स्कूलों में नामांकन लेनेवाले तथा छोड़नेवाले छात्रों की संख्या।

उपरोक्त सरणी में A=नामांकन लेनेवाले छात्र तथा L= स्कुल छोड़नेवाले छात्र
किस वर्ष तथा किस स्कुल में नामांकन लेनेवाले तथा स्कूल छोड़नेवाले छात्रों की संख्याओं का अनुपात था ?
1999,D
2001, A
2000, A
2001, E
The correct Answer is:D
Step by step video & image solution for विभिन्न वर्षो में पांच स्कूलों में नामांकन लेनेवाले तथा छोड़नेवाले छात्रों की संख्या। उपरोक्त सरणी में A=नामांकन लेनेवाले छात्र तथा L= स्कुल छोड़नेवाले छात्र किस वर्ष तथा किस स्कुल में नामांकन लेनेवाले तथा स्कूल छोड़नेवाले छात्रों की संख्याओं का अनुपात 4:1 था ? by Maths experts to help you in doubts & scoring excellent marks in Class 14 exams.
Updated on:21/07/2023Topper's Solved these Questions
Similar Questions

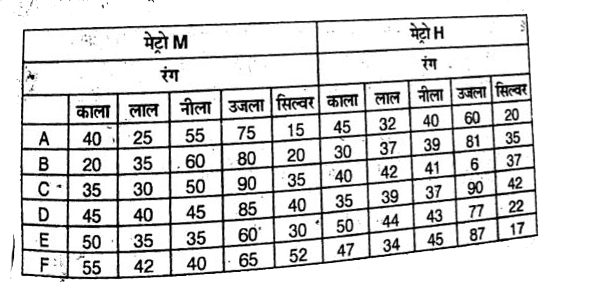
दोनों मेट्रो शहरो में किस नमूना के उजले रंग के कारो की बेचीं गयी संख्याओं में अंतर न्यूनतम है ?
View Solution400 रु. को राशि पर 5% वार्षिक दर से 73 दिनों का साधारण ब्याज क्या होगा ?
View SolutionMatch the following Column A to Column B

View Solutionयह ज्ञात है की महाविद्यालय के छात्रों में से 60 % छात्रावास में रहते है और 40 % छात्रावास में नहीं रहते है । पूर्ववर्ती वर्ष से परिणाम सूचित करते है की छात्रावास में रहने वाले छात्रों में से30 % छात्रों में से 20 % छात्रों ने A ग्रेड लिए। वर्ष के अंत में महाविद्यालय के एक छात्र को यादृच्छया चुना गया और पाया गया की उसे A ग्रेड मिला है । इस बात की क्या प्रायिकता है की वह छात्रावास में रहने वाला है ?
View Solutionविभिन्न माध्यमों में ध्वनि की चाल|ध्वनि का परावर्तन तथा प्रतिध्वनि#!#सोनार
View Solutionएक बस 3 घण्टे में 126 किमीo तथा एक ट्रेन 5 घण्टे में 315km दूरी तय करते है। बस तथा ट्रेन की चालों का अनुपात ज्ञात करो।
View SolutionThe ratio of boys and girls in a college was 4 : 5. New students got admitted and the number of boys went up by 50% and the number of girls went up by 60%. What is the new ratio of boys and girls in the college?
एक कॉलेज में लड़कों तथा लड़कियों की संख्या में 4 : 5 का अनुपात है | नए छात्रों का नामांकन हुआ और लड़कों की संख्या 50% तथा लड़कियों की संख्या 60% बढ़ गयी | इस कॉलेज में लड़कों और लड़कियों का नया अनुपात क्या है ?
View SolutionThe ratio of the number of boys to the number of girls in a school of 640 students is 5:3. If 30 more girls are admitted in the school, then how many more boys should be admitted so that the ratio of boys to that of the girls, becomes 14:9
640 छात्रों वाले एक विद्यालय में लड़कों की संख्या तथा लड़कियों की संख्या में 5 : 3 का अनुपात है | यदि इस विद्यालय में 30 और लड़कियों का नामांकन हो जाता है, तो कितने अतिरिक्त लड़कों का नामांकन होना चाहिए ताकि लड़कों और लड़कियों की संख्या का अनुपात 14 : 9 हो जाए |
View SolutionThe table below indicates the percentage of students and the ratio of boys and girls in the various streams of a college. (Total students = 2600) नीचे दी गयी तालिका छात्रों का प्रतिशत तथा कॉलेज के विभिन्न विषयों में लड़कों तथा लड़कियों का अनुपात दर्शाती है | ( कुल छात्र = 2600 ) What is the ratio of students studying in CS and IT? CS और IT में पढ़ रहे छात्रों का अनुपात कया है ?
View SolutionThe table below indicates the percentage of students and the ratio of boys and girls in the various streams of a college. (Total students = 2600) नीचे दी गयी तालिका छात्रों का प्रतिशत तथा कॉलेज के विभिन्न विषयों में लड़कों तथा लड़कियों का अनुपात दर्शाती है | ( कुल छात्र = 2600 ) If the data about the number of girls enrolled in the various streams is represented by a pie-chart, what is the central angle of the sector representing the number of girls in the ME stream, to the nearest whole degree? यदि विभिन्न विषयों में नामांकन लेने वाली लड़कियों की संख्या से संबंधित आंकड़ों को एक पाई-चार्ट के द्वारा दर्शाया जाए, तो ME विषय में लड़कियों की संख्या को दर्शाने वाले खंड का केंद्रीय कोण ( निकटतम पूर्ण डिग्री में ) क्या होगा ?
View SolutionThe table below indicates the percentage of students and the ratio of boys and girls in the various streams of a college. (Total students = 2600) नीचे दी गयी तालिका छात्रों का प्रतिशत तथा कॉलेज के विभिन्न विषयों में लड़कों तथा लड़कियों का अनुपात दर्शाती है | ( कुल छात्र = 2600 ) In which stream, is the difference in the percentage of boys and girls minimum? किस विषय में, लड़कों एवं लड़कियों के प्रतिशत में सबसे कम अंतर है ?
View SolutionThe table below shows the number of students enrolled in five colleges over the five years (2010 to 2014). यह तालिका पांच कॉलेजों में पांच वर्षों ( 2010 से 2014 ) के दौरान नामांकन लेने वाले छात्रों की संख्या दर्शाती है | What is the average number of students studying in college D over the given years? इन वर्षों में कॉलेज D में पढ़ने वाले छात्रों की औसत संख्या कितनी है ?
View SolutionThe table below shows the number of students enrolled in five colleges over the five years (2010 to 2014). यह तालिका पांच कॉलेजों में पांच वर्षों ( 2010 से 2014 ) के दौरान नामांकन लेने वाले छात्रों की संख्या दर्शाती है | In the year 2014, what percent of students were enrolled in college C (correct to one decimal place)? वर्ष 2014 में, कितने प्रतिशत छात्रों ने कॉलेज C में नामांकन करवाया था ? ( एक दशमलव स्थान तक )
View SolutionThe table below shows the number of students enrolled in five colleges over the five years (2010 to 2014). यह तालिका पांच कॉलेजों में पांच वर्षों ( 2010 से 2014 ) के दौरान नामांकन लेने वाले छात्रों की संख्या दर्शाती है | What is the ratio of the total students enrolled in colleges A and B in the year 2012 to the total students enrolled in colleges D and E in the year 2013? वर्ष 2012 में कॉलेज A और B में नामांकन लेने वाले कुल छात्रों की संख्या का वर्ष 2013 में कॉलेज D और E में नामांकन लेने वाले कुल छात्रों की संख्या के साथ अनुपात ज्ञात करें|
View SolutionThe given bar graph presents the number of students from Science and Arts streams from a school in different years. दिया गया दंड आरेख अलग-अलग वर्षों में एक विद्यालय में विज्ञान एवं कला संकाय के छात्रों की संख्या को दर्शाता है | What is the ratio of the total number of Science students in 2011 and 2015 to that of Arts in 2012 and 2015? 2011 तथा 2015 में विज्ञान के छात्रों की कुल संख्या का 2012 तथा 2015 में कला के छात्रों की कुल संख्या के साथ अनुपात ज्ञात करें |
View SolutionThe given Bar Graph presents the number of students enrolled for a vocational course in institutes A and B during a period of five years. दिया गया दंड आरेख A और B संस्थानों में पांच वर्षों की अवधि के दौरान व्यावसायिक पाठ्यक्रमों नामांकन लेने वाले छात्रों की संख्या को दर्शाता है | The average number of students (per year) enrolled in B during 2015, 2016 and 2018 is what percentage more than the number of students enrolled in A during 2017? 2015, 2016 और 2018 में B में नामांकन ( प्रति वर्ष ) लेने वाले छात्रों की औसत संख्या 2017 के दौरान A में नामांकन लेने वाले छात्रों की संख्या से कितना प्रतिशत अधिक है ?
View Solution
