निम्नलिखित प्रत्येक सरणी को पढ़िए और उसके नीचे दिए गए प्रश्नो का उत्तर दीजिये।

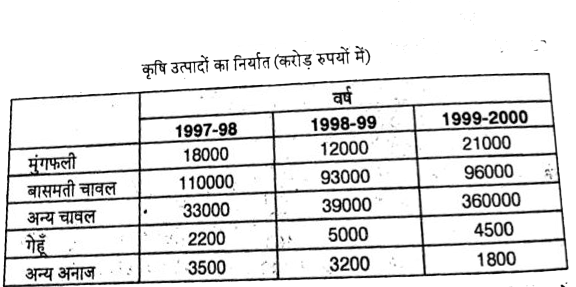
किस उत्पाद के लिए वर्ष के कुल निर्यात की तुलना में प्रतिशत निर्यात तीनो वर्षो में लगातार बढ़ा है ?
मूंगफली, बासमती चावल
बासमती चावल, गेहूं
गेहूं मूंगफली
इनमे से कोई नहीं
The correct Answer is:D
Step by step video & image solution for निम्नलिखित प्रत्येक सरणी को पढ़िए और उसके नीचे दिए गए प्रश्नो का उत्तर दीजिये। किस उत्पाद के लिए वर्ष के कुल निर्यात की तुलना में प्रतिशत निर्यात तीनो वर्षो में लगातार बढ़ा है ? by Maths experts to help you in doubts & scoring excellent marks in Class 14 exams.
Updated on:21/07/2023Topper's Solved these Questions
Similar Questions

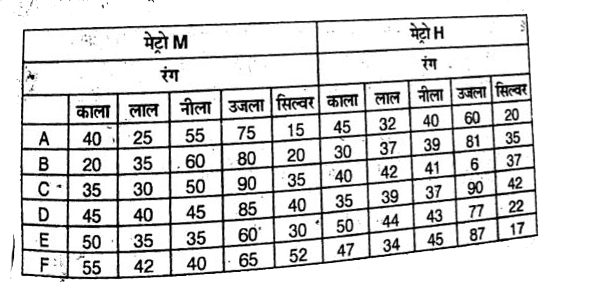
दोनों मेट्रो शहरो में किस नमूना के उजले रंग के कारो की बेचीं गयी संख्याओं में अंतर न्यूनतम है ?
View Solution400 रु. को राशि पर 5% वार्षिक दर से 73 दिनों का साधारण ब्याज क्या होगा ?
View SolutionWhich of the following are correct chain isomers of butane ? (i)
View SolutionDetermine the point of symmetry of a regular hexagon.
View SolutionDtermine the images of the following figure about the given line :
View SolutionMatch the following Column A to Column B

View SolutionMatch the following Column A to Column B

View SolutionMatch the following Column A to Column B

View SolutionThe inequation represented by the graph given below is :
View SolutionThe inequation that best describes the graph given below is _________
View SolutionThe inequation that best describes the following graph is _________
View Solutionनिम्नलिखित पद्यांश को पढ़कर उसके नीचे दिए गए प्रश्नों के उत्तर मात्र एक-एक वाक्य में लिखिए :
ज्यौं रहीम गति दीप की, कुल कपूत गति सोइ ।
बारै उजियारो करै, बढ़े अंधेरो होइ ।।
Q. उपर्युक्त दोहा किस कविता का है ?
View Solutionनिम्नलिखित पद्यांश को पढ़कर उसके नीचे दिए गए प्रश्नों के उत्तर मात्र एक-एक वाक्य में लिखिए : ज्यौं रहीम गति दीप की, कुल कपूत गति सोइ । बारै उजियारो करै, बढ़े अंधेरो होइ ।। Q. उपर्युक्त दोहा किस कवि का है ?
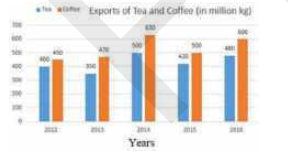
View SolutionThe given Bar Graph presents the Export of Tea and Coffee (in million kg) for the years 2012 to 2016.
दिया गया दंड आरेख वर्ष 2012 से 2016 के दौरान चाय और कॉफ़ी के निर्यात ( मिलियन किलो ग्राम में ) को दर्शाता है |
The number of years, in each of which the export of coffee is more than 20% as compared to the export of tea in that year is:
ऐसे कितने वर्ष हैं जिनमें से प्रत्येक में कॉफ़ी का निर्यात इस वर्ष में चाय के निर्यात की तुलना में 20% अधिक है ?
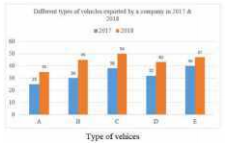
View SolutionThe given Bar Graph presents the number of different types of vehicles exported by a company in 2017 and 2018.The average export of vehicles in 2018 is what percent more than the export of vehicle A in 2017?
दिया गया दंड आरेख एक कंपनी के द्वारा 2017 और 2018 में निर्यात किये गए अलग-अलग प्रकार के वाहनों की संख्या को दर्शाता है |
2018 में वाहनों का औसत निर्यात 2017 में वाहन A के निर्यात से कितना प्रतिशत अधिक है ?
View Solution'A' is the portion of adenophypophysis which secrets different hormones 'A' is____
View Solution
