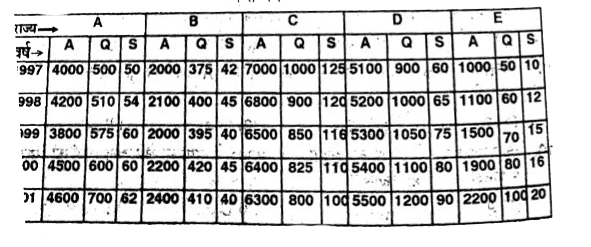
पांच राज्यों A, B, C, D तथा E में वर्ष 1997 से 2001 तक में किसी परीक्षा में शामिल (A) उत्तीर्ण (Q) तथा अंतिम रूप से चयनीत (S) छात्र

राज्य E में उत्तीर्ण छात्रों की औसत संख्या, राज्य C में उत्तीर्ण छात्रों की औसत संख्या का लगभग कितना प्रतिशत है ?
15%
8%
10%
5%
The correct Answer is:B
Step by step video & image solution for पांच राज्यों A, B, C, D तथा E में वर्ष 1997 से 2001 तक में किसी परीक्षा में शामिल (A) उत्तीर्ण (Q) तथा अंतिम रूप से चयनीत (S) छात्र राज्य E में उत्तीर्ण छात्रों की औसत संख्या, राज्य C में उत्तीर्ण छात्रों की औसत संख्या का लगभग कितना प्रतिशत है ? by Maths experts to help you in doubts & scoring excellent marks in Class 14 exams.
Topper's Solved these Questions
Similar Questions

दोनों मेट्रो शहरो में किस नमूना के उजले रंग के कारो की बेचीं गयी संख्याओं में अंतर न्यूनतम है ?06:14View Solution400 रु. को राशि पर 5% वार्षिक दर से 73 दिनों का साधारण ब्याज क्या होगा ?
03:07View Solutionयह ज्ञात है की महाविद्यालय के छात्रों में से 60 % छात्रावास में रहते है और 40 % छात्रावास में नहीं रहते है । पूर्ववर्ती वर्ष से परिणाम सूचित करते है की छात्रावास में रहने वाले छात्रों में से30 % छात्रों में से 20 % छात्रों ने A ग्रेड लिए। वर्ष के अंत में महाविद्यालय के एक छात्र को यादृच्छया चुना गया और पाया गया की उसे A ग्रेड मिला है । इस बात की क्या प्रायिकता है की वह छात्रावास में रहने वाला है ?
03:19View SolutionThe total number of students in section A and B of a class is 110. The number of students in section A is 10 more than that of section B. The average score of the students in B, in a test, is 20% more than that of students in A. If the average score of all the students in the class is 72, then what is the average score of the students in A?
किसी कक्षा के खंड A और खंड B के छात्रों की कुल संख्या 110 है | खंड A में छात्रों की संख्या खंड 9 के छात्रों की संख्या से 10 अधिक है| किसी परीक्षा में B के छात्रों का औसत प्राप्तंक A के छात्रों के औसत प्राप्तंक से 20% अधिक है | यदि सभी छात्रों का औसत प्राप्तांक 72 है, तो A के छात्रों का औसत प्राप्तांक ज्ञात करें |03:52View SolutionIn an examination, the average score of students in a class who passed is 69 and that of who failed is 61. If the average score of all the students, who appeared in the examination is 66, then the percentage of students who passed is:
एक परीक्षा में, किसी कक्षा में पास करने वाले छात्रों का औसत अंक 69 है तथा फेल करने वाले छात्रों का औसत अंक 61 है | यदि परीक्षा में शामिल होने वाले सभी छात्रों का औसत अंक 66 है, तो पास करने वाले छात्रों का प्रतिशत ज्ञात करें |03:42View SolutionThe number of students in classes A and B are 60 and 70, respectively. The average score in mathematics of students in B is 57 and that of all students in A and B is 63. What is the average score of students in A?
कक्षा A और B में छात्रों की संख्या क्रमश: 60 और 10 है | B में गणित में छात्रों का औसत अंक 57 तथा A और B के सभी छात्रों का गणित में औसत अंक 63 है |A के छात्रों का औसत अंक ज्ञात करें |02:55View SolutionThere are 96 students in a class, out of which the number of girls is 40% more than that of the boys. The average score in mathematics of the boys is 40% more than the average score of girls. If the average score in mathematics of all the students is 63, then what is the average score of the girls in mathematics?
एक कक्षा में 96 छात्र हैं, जिनमें से लड़कियों की संख्या लड़कों की संख्या से 40% अधिक है | लड़कों का गणित में औसत प्राप्तांक लड़कियों के औसत प्राप्तांक से 40% अधिक है | यदि गणित में सभी छात्रों का औसत प्राप्तांक 63 है, तो गणित में लड़कियों का औसत प्राप्तांक ज्ञात करें |01:58View SolutionThe average score in Mathematics of 90 students of sections A and B together is 49. The number of students in A was 25% more than that of B, and the average score of the students in B was 20% higher than that of the students in A. What is the average score of the students in A?
खंड A तथा खंड B के 90 छात्रों का गणित में औसत अंक 49 है | A के छात्रों की संख्या B के छात्रों से 25% अधिक है तथा B के छात्रों का औसत अंक A के छात्रों के औसत अंक से 20% अधिक है | A के छात्रों का औसत अंक कितना है ?02:37View SolutionThe table below shows the number of students enrolled in five colleges over the five years (2010 to 2014). यह तालिका पांच कॉलेजों में पांच वर्षों ( 2010 से 2014 ) के दौरान नामांकन लेने वाले छात्रों की संख्या दर्शाती है | What is the average number of students studying in college D over the given years? इन वर्षों में कॉलेज D में पढ़ने वाले छात्रों की औसत संख्या कितनी है ?
02:20View SolutionThe table below shows the number of students enrolled in five colleges over the five years (2010 to 2014). यह तालिका पांच कॉलेजों में पांच वर्षों ( 2010 से 2014 ) के दौरान नामांकन लेने वाले छात्रों की संख्या दर्शाती है | The number of students studying in college E in the year 2013 is approximately what percent of the number of students studying in colleges B, C and D taken together in the year 2013 (nearest to one decimal place) वर्ष 2013 में कॉलेज E में पढ़ रहे छात्रों की संख्या वर्ष 2013 में कॉलेज B, C एवं D में पढ़ने वाले छात्रों की कुल संख्या का लगभग कितना प्रतिशत है ? ( एक दशमलव स्थान के निकटतम )
02:31View SolutionThis table shows the number of students studying in various streams in different colleges. निम्नलिखित तालिका पांच कॉलेजों के तीन विषयों में पढ़ने वाले छात्रों की संख्या दर्शाती है | The number of students in the science stream of college C is approximately what percentage of students studying in that college? कॉलेज C में विज्ञान विषय में छात्रों की संख्या उस कॉलेज में पढ़ने वाले छात्रों की संख्या का लगभग कितना प्रतिशत है ?
02:57View SolutionThe given Bar Graph presents the number of students of two schools for six years. दिया गया दंड आरेख छः वर्ष की अवधि में दो विद्यालयों में छात्रों की संख्या को दर्शाता है | In which year, the percentage increase in students in school B is the highest in comparison to its previous year? किस वर्ष में, विद्यालय B में छात्रों की संख्या में प्रतिशत वृद्धि इसके पिछले वर्ष की तुलना में सबसे अधिक रही है?
01:48View SolutionThe given Bar Graph presents the number of students of two schools for six years. दिया गया दंड आरेख छः वर्ष की अवधि में दो विद्यालयों में छात्रों की संख्या को दर्शाता है | In which year, the percentage increase of students in school A is the highest in comparison to its previous year? किस वर्ष, विद्यालय A में छात्रों की संख्या में प्रतिशत वृद्धि पिछले वर्ष की तुलना में सर्वाधिक है ?
04:06View SolutionIn the given bar graph, the percentage decrease in the number of students in Institute A in 2016 is what percent of students in 2015. इस दंड आरेख में संस्थान A में 2016 में छात्रों की संख्या में प्रतिशत कमी 2015 के छात्रों की संख्या का क्या प्रतिशत है ?
03:04View SolutionThe given pie chart shows the percentage of students enrolled for the courses A, B, C, D and E in a university and the table shows the percentage of students that passed, out of the enrolled students.
दिया गया पाई चार्ट एक विश्वविद्यालय में पाठ्यक्रम A, B, C, D और E के लिए नामांकित छात्रों के प्रतिशत को दर्शाता है और तालिका उन छात्रों का प्रतिशत दिखाती है, जो नामांकित छात्रों में से उत्तीर्ण हुए हैं।
 If the total number of students is 60000, then the total number of students who did not pass in the
courses A, C is:
यदि छात्रों की कुल संख्या 60000 है, तो कुल छात्रों की संख्या, जो पाठ्यक्रम A, C में उत्तीर्ण नहीं हुए हैं:02:59View SolutionStudy the pie chart and answer the question that follows
आरेख का अध्ययन करें और प्रश्न का उत्तर दे।
Break up (degree wise) of students in terms of specialization in different areas (A,B,C,D&E) in MBA program.
MBA कार्यक्रम में विभिन्न क्षेत्रों (A, B, C, D और E) में विशेषज्ञता के संदर्भ में छात्रों का वितरण
The number of students specialising in E is what percent more than that of students specialising in C?
E में विशेषज्ञता प्राप्त छात्रों की संख्या, C में विशेषज्ञता प्राप्त छात्रों की संख्या की तुलना में कितना प्रतिशत अधिक है?01:13View Solution

