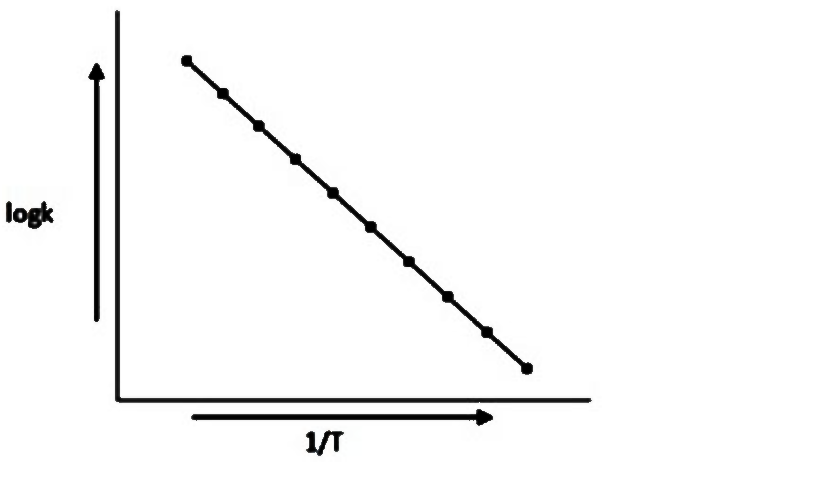
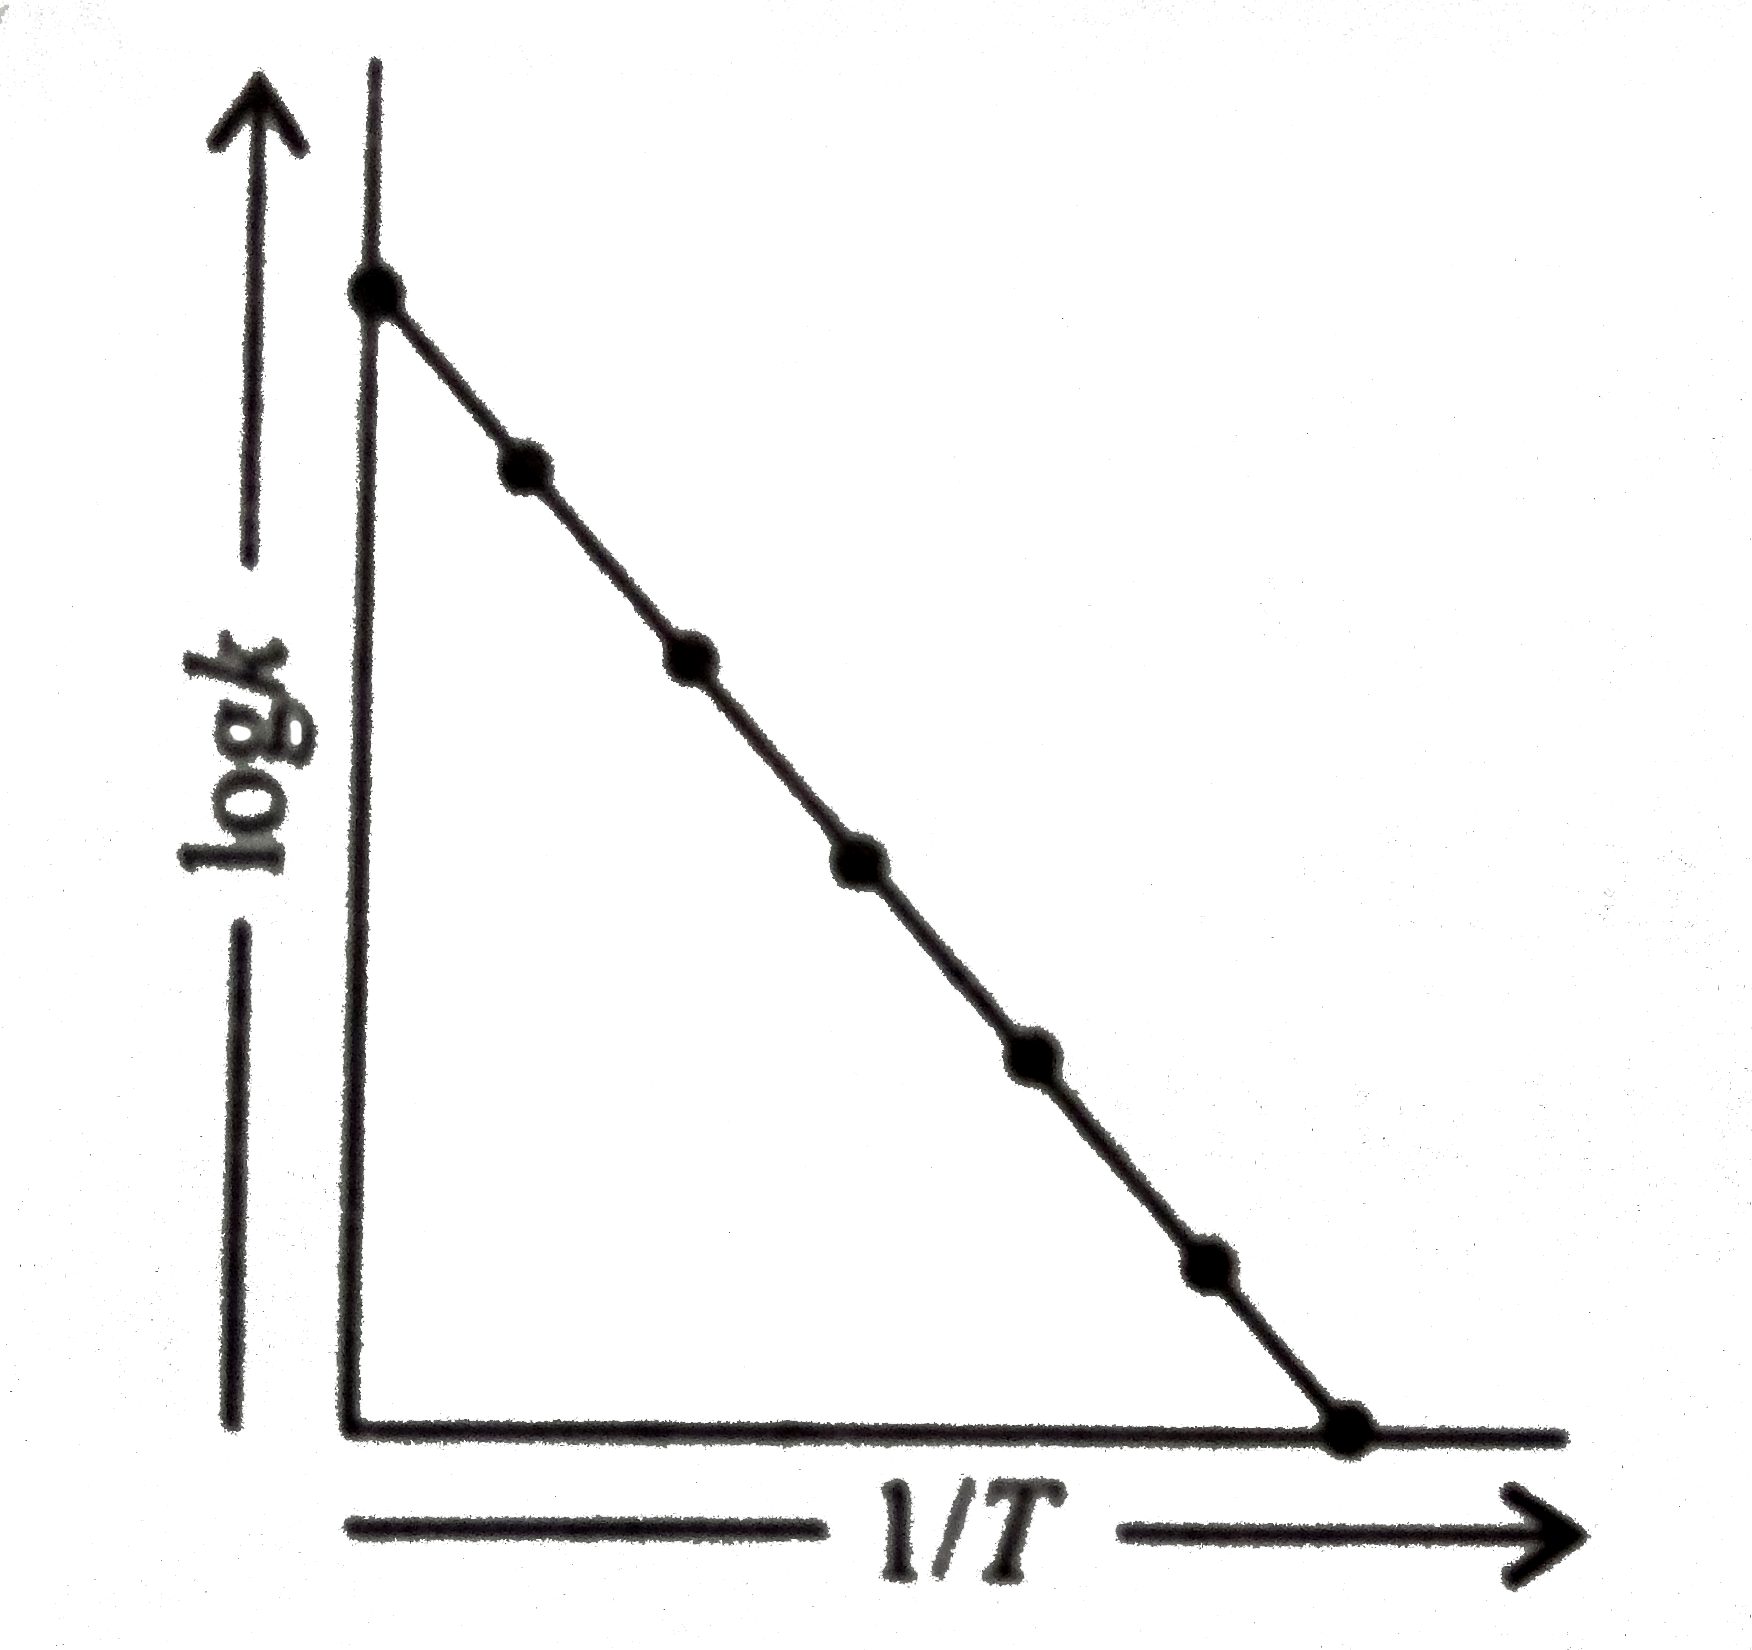
When a plot between logk and 1/T is plotted we get the graph as shown.

What is the value of slope in the graph?
A
B
C
D
Video Solution
Text Solution
The correct Answer is:B
|
Answer
Step by step video & image solution for When a plot between logk and 1/T is plotted we get the graph as shown. What is the value of slope in the graph? by Chemistry experts to help you in doubts & scoring excellent marks in Class 12 exams.
Updated on:21/07/2023Similar Questions
Knowledge Check
In a plot of log.k vs 1/T, the slope'is :
A−Ea/2⋅303BEa/2⋅303RCEa/2⋅303D−Ea/2⋅303RIn a plot of log k vs 1/T, the slope is
A−Ea/2.303BEa/2.303RCEa/2.303D−Ea/2.303RIn a plot of log k vs 1/T, the slope is
A−Ea/2.303BEa/2.303RCEa/2.303D−Ea/2.303R
Magnitude of slope of the shown graph.

View SolutionWhat do we get for a plot between V and 1/P ?
View SolutionIn Searl's experiment a graph is plotted between
View SolutionAt constant temperature if a graph plotted between logP and log(1V) has an intercept of unity then what will be the value of constant (k)
View SolutionIn a plot of log k vs 1/T, the slope is
View Solution

