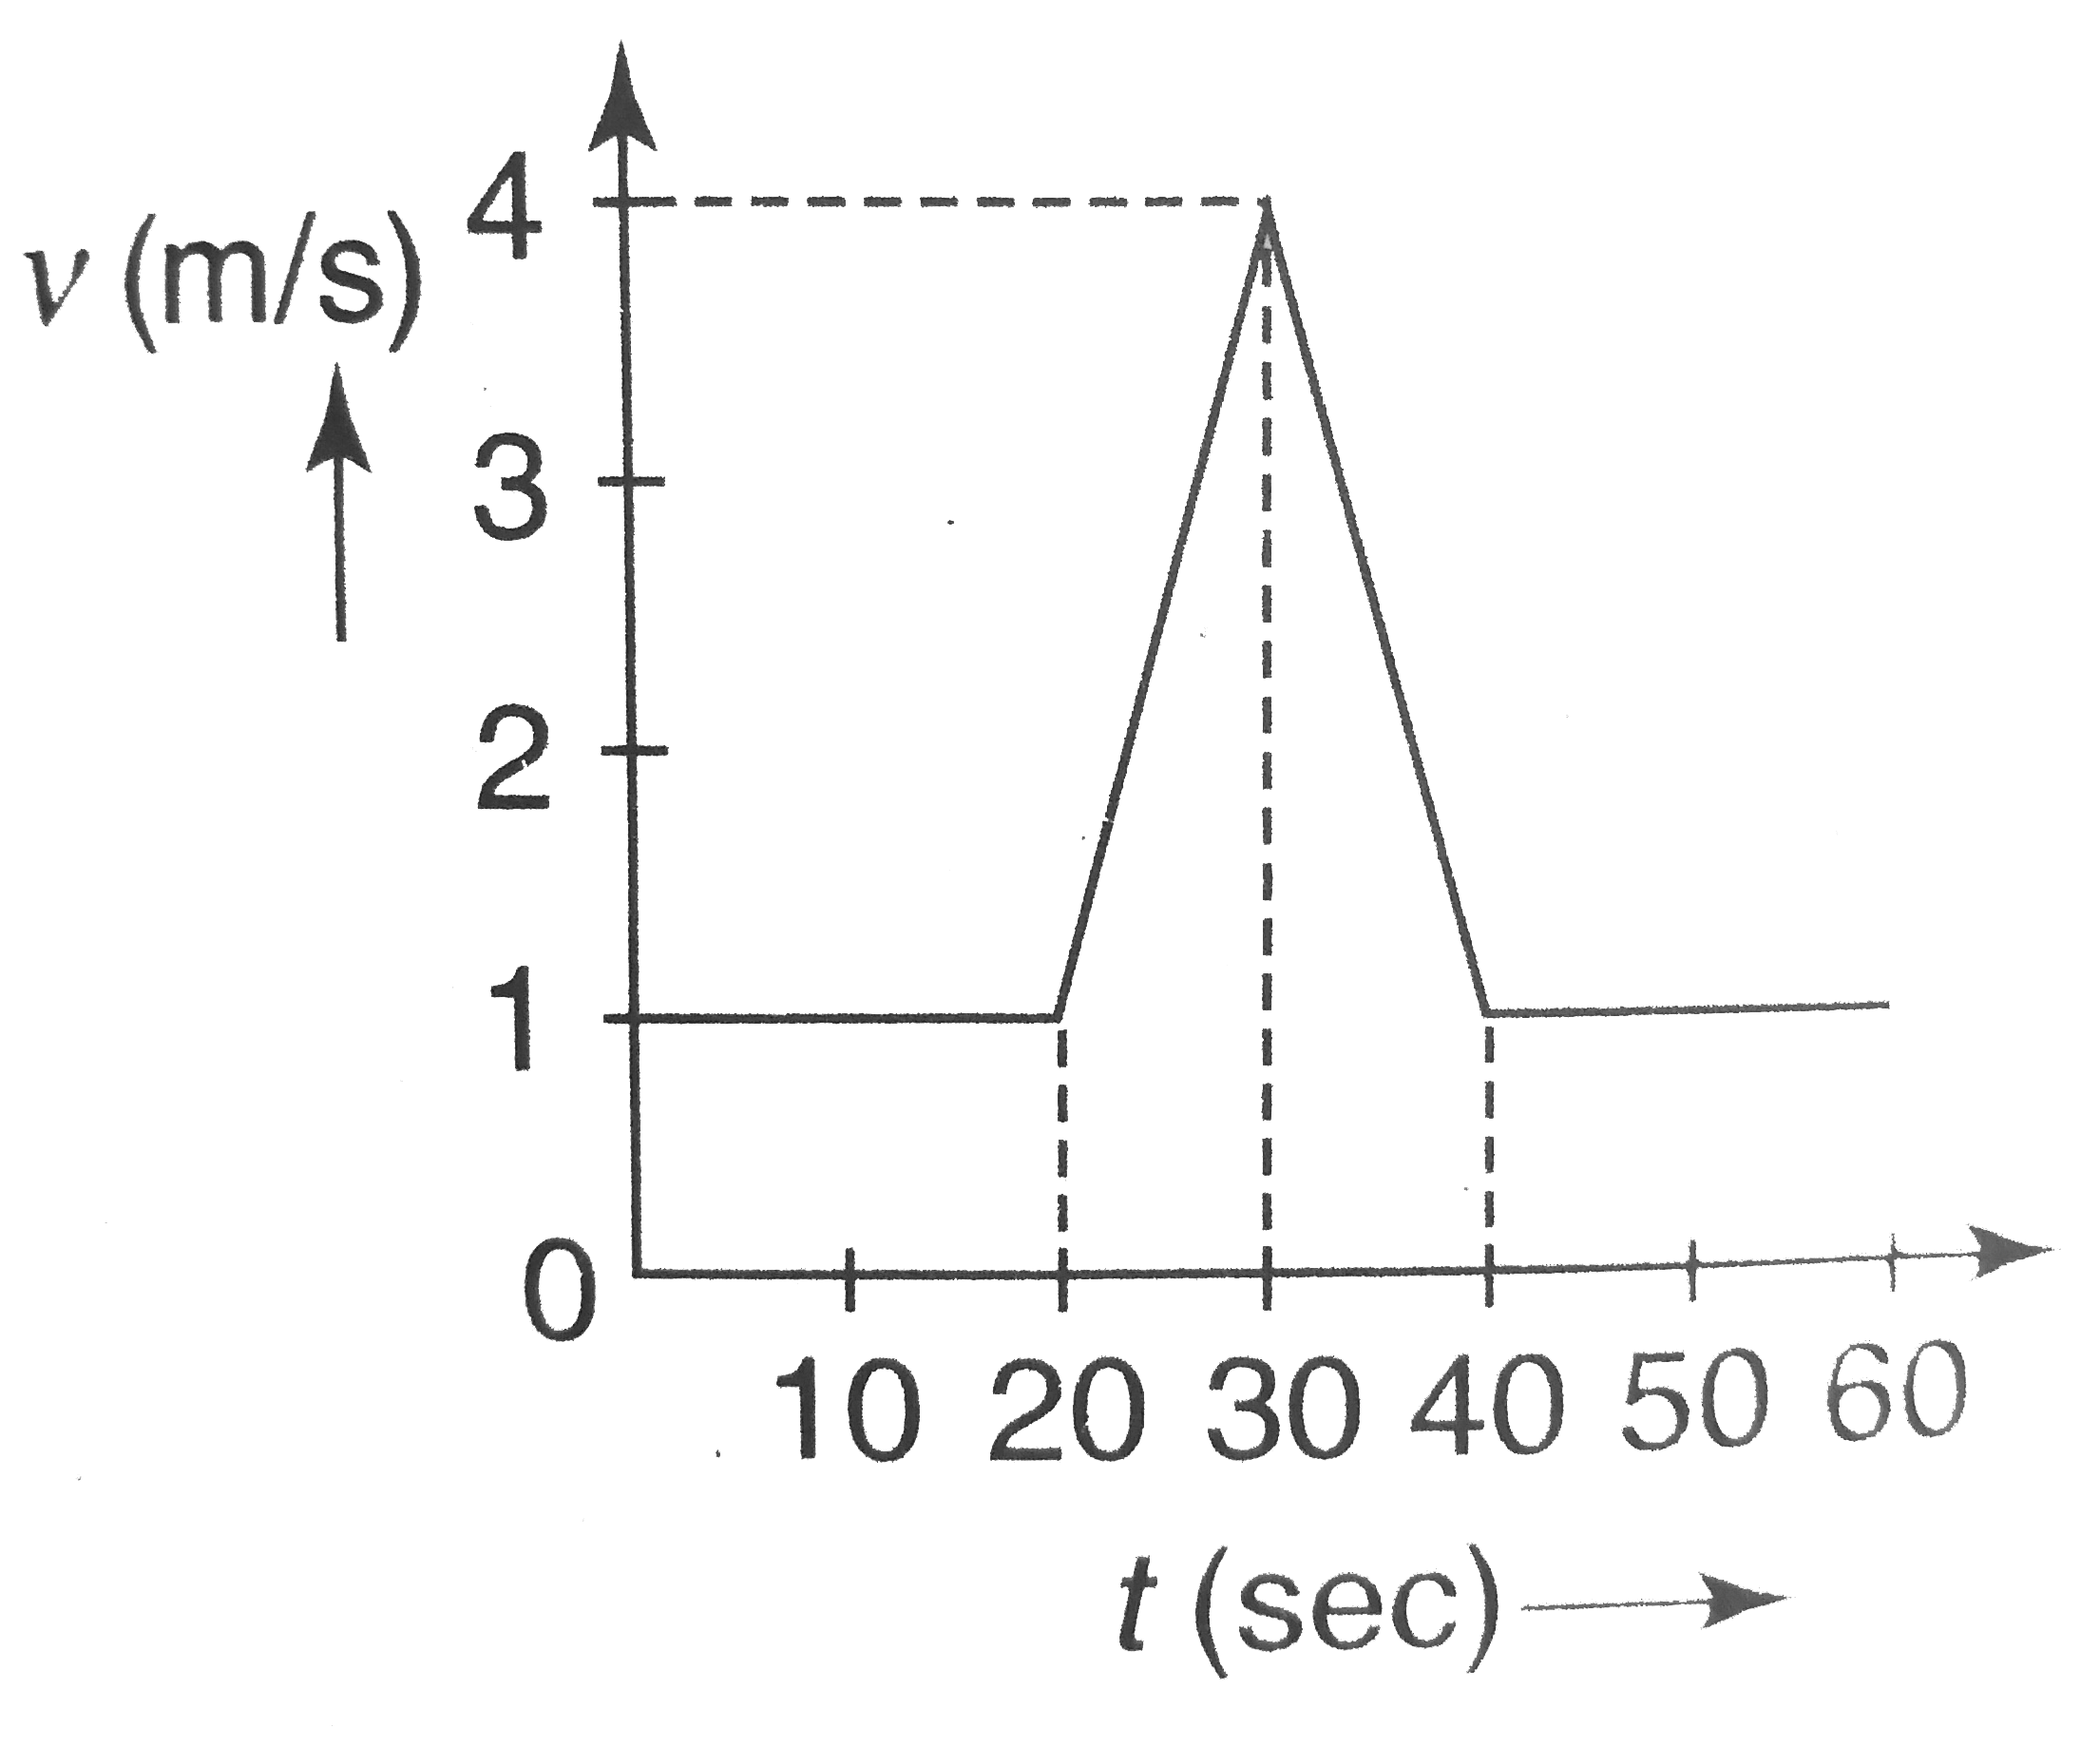
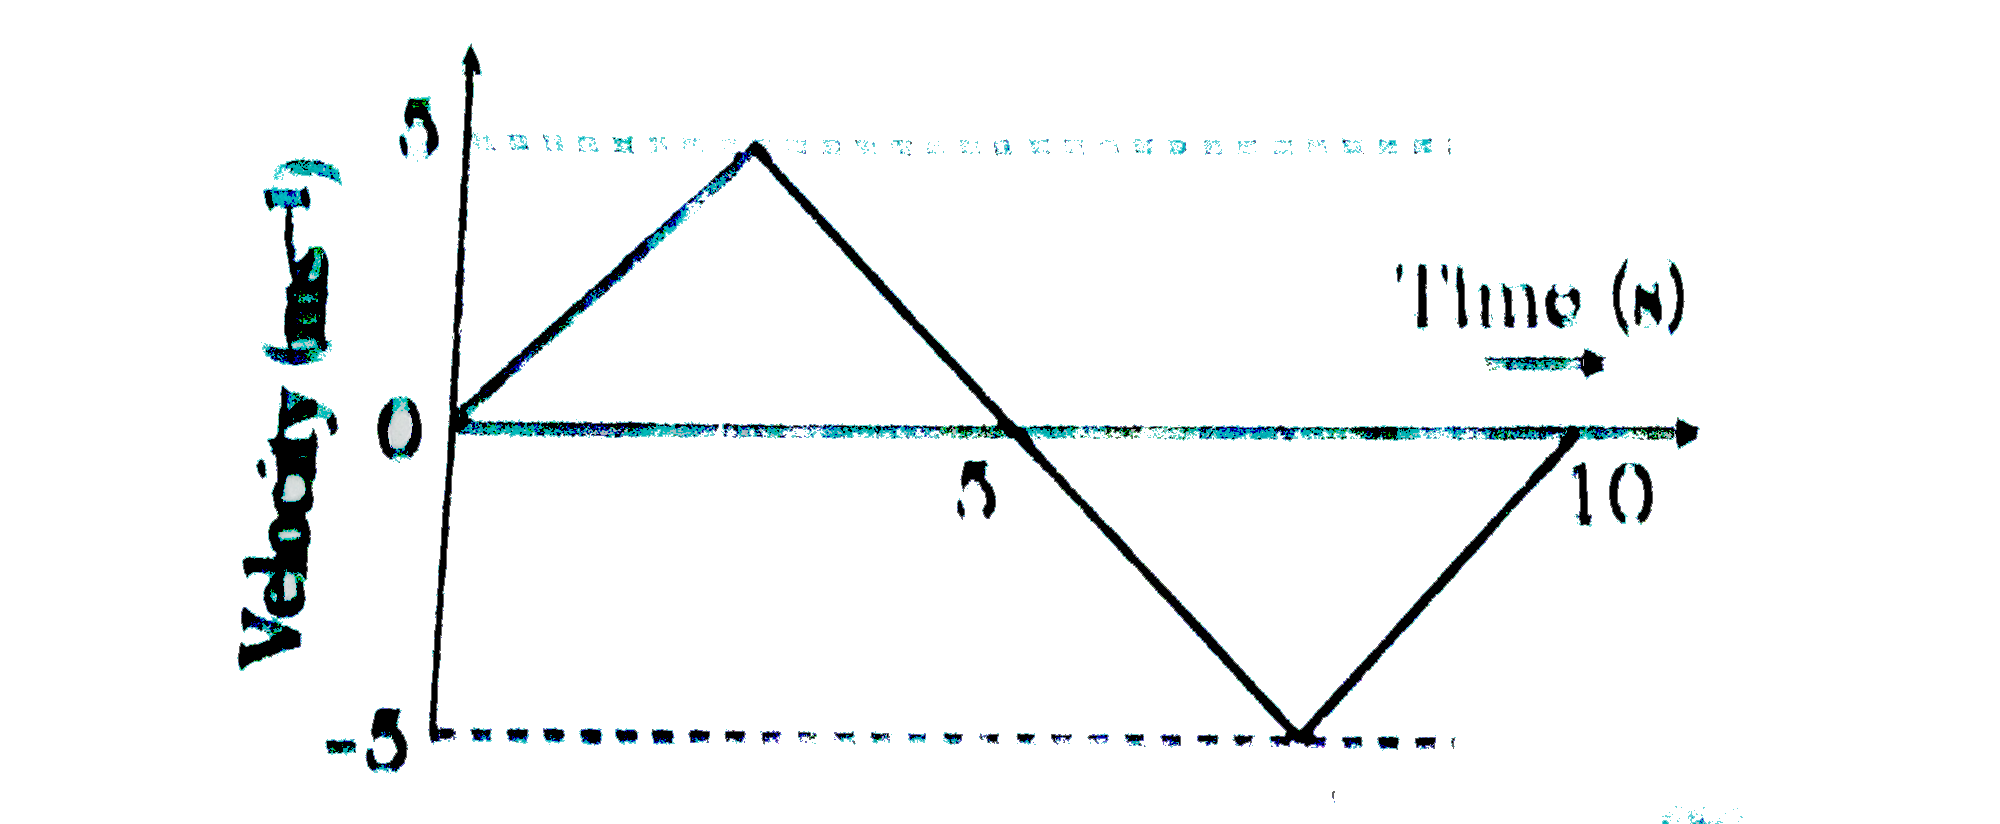
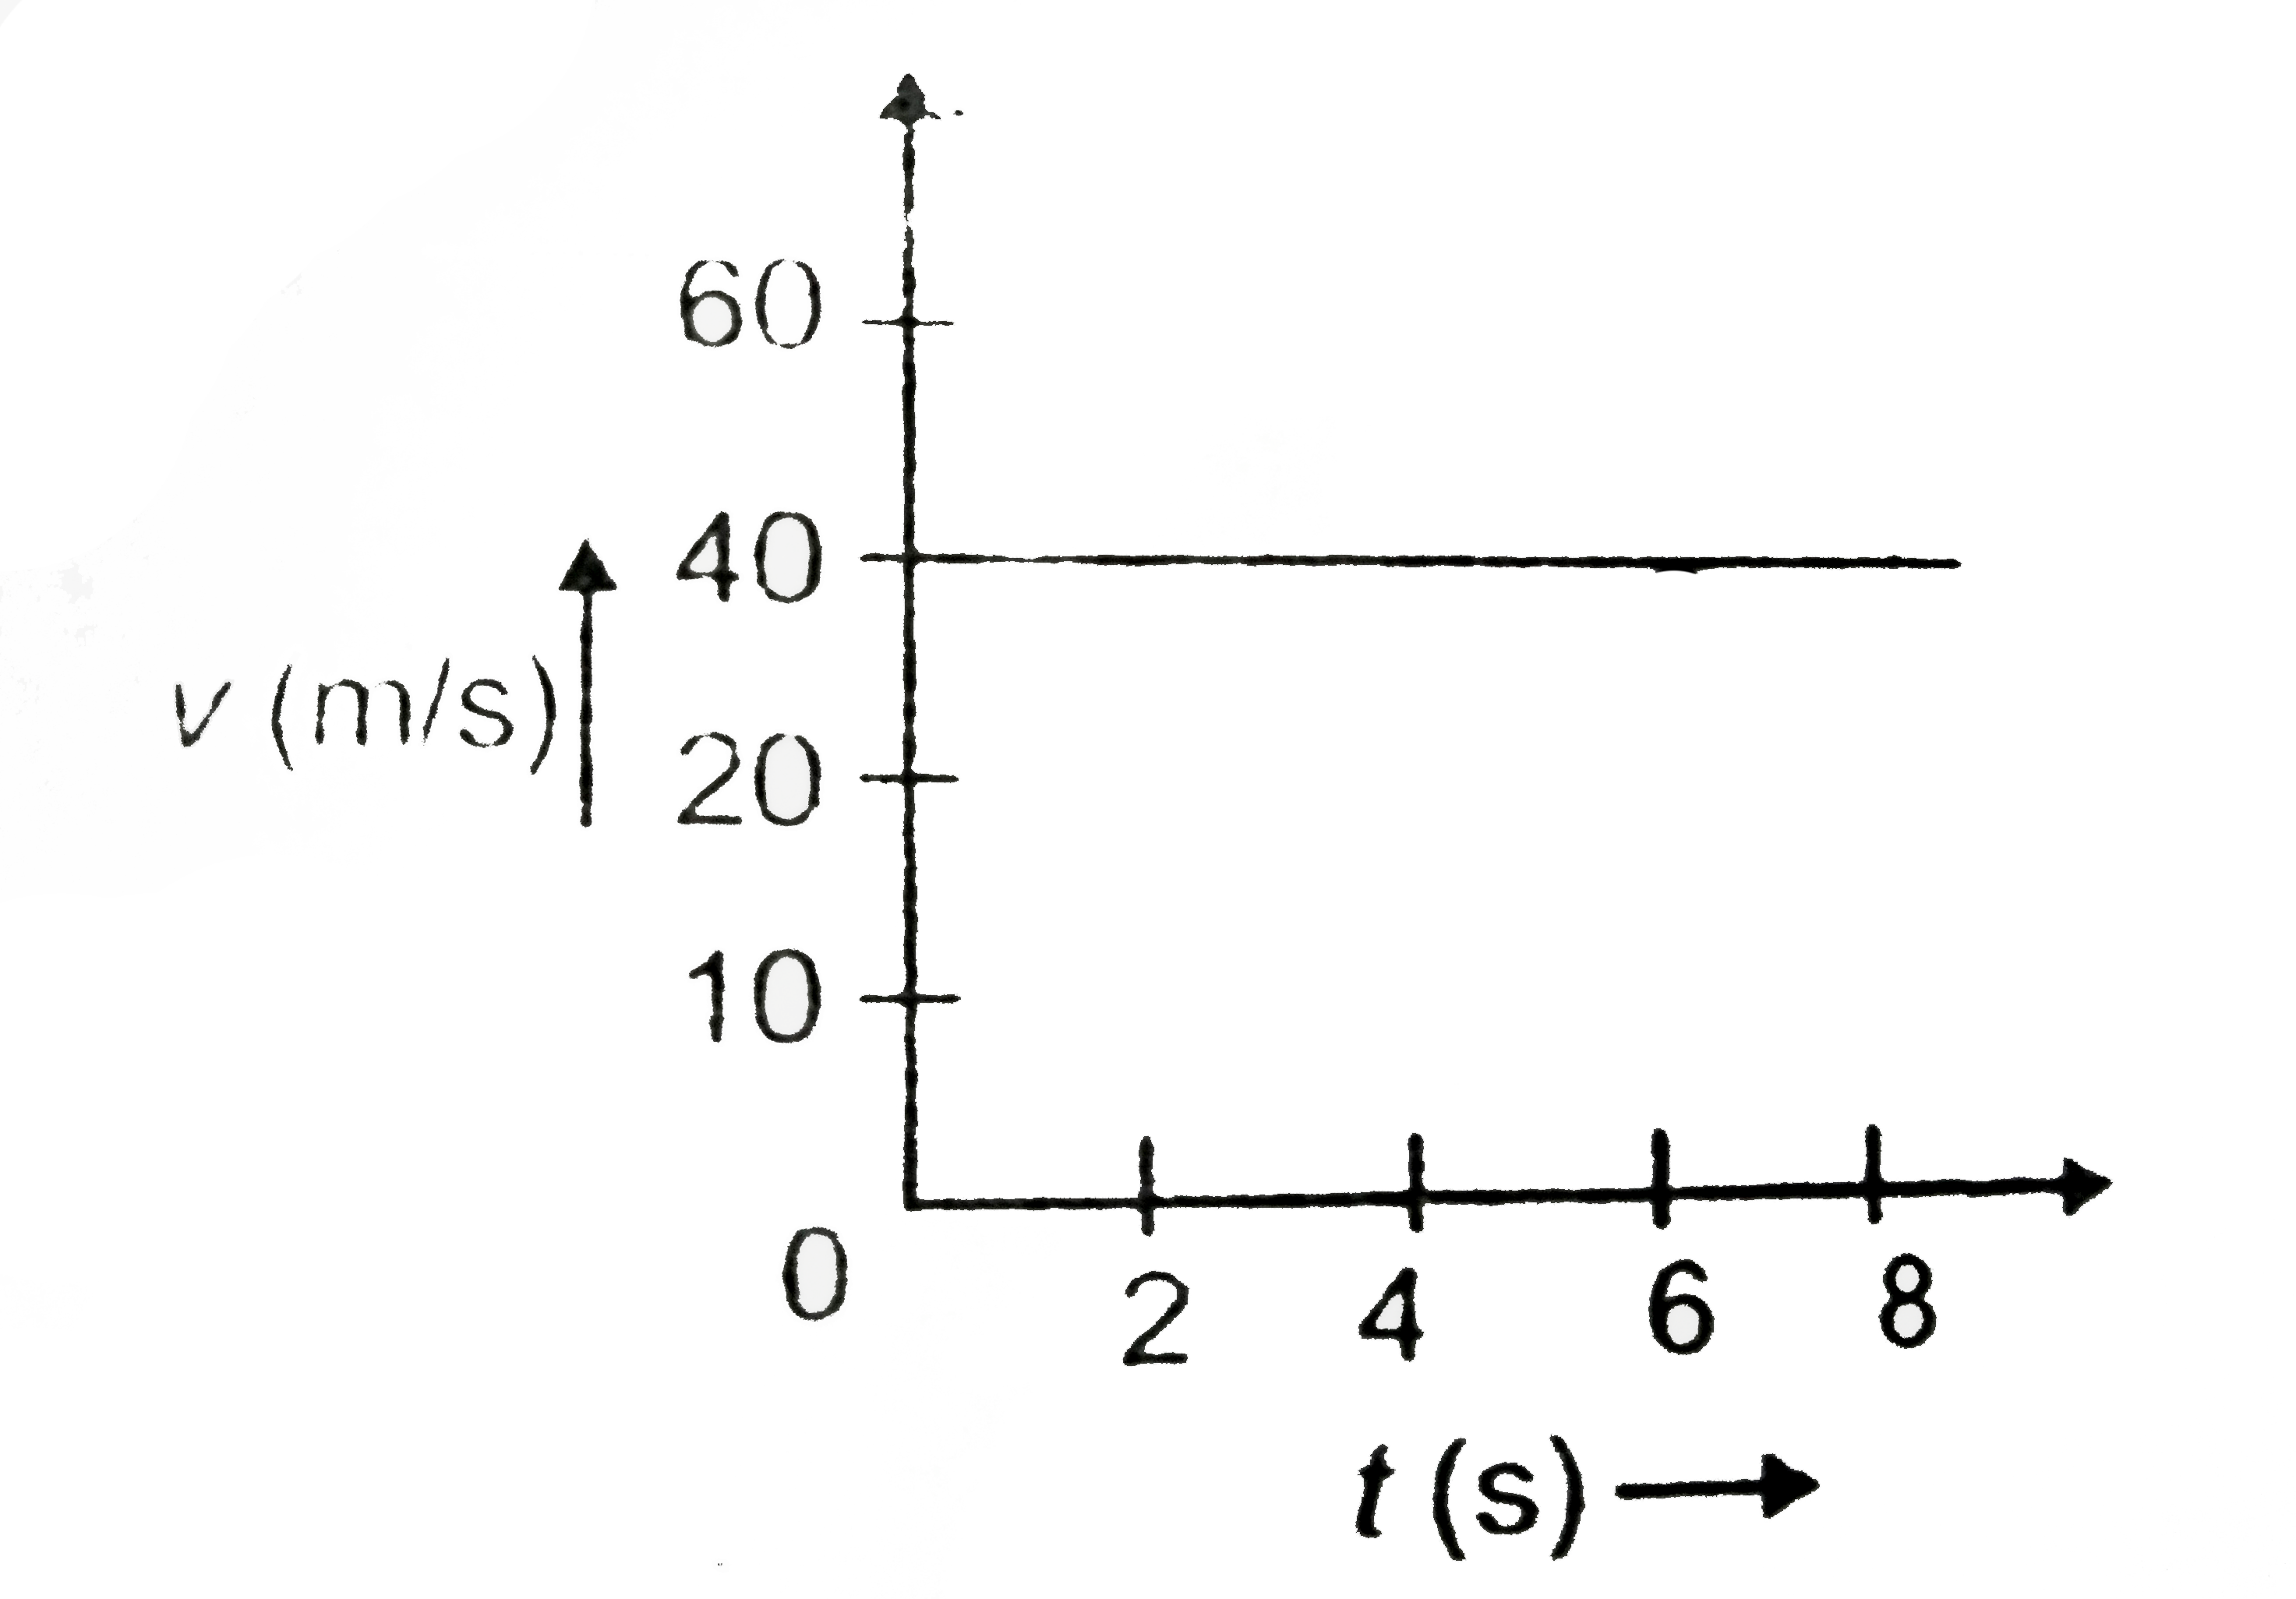
Velocity-time graph for a moving object is shown in the figure. Total displacement of the object during the time interval when there is non-zero acceleration and retardation is.
The correct Answer is:(A)-r, (B)-q, (C)-r (D)-p
Rθ=vt,θ=4×11=4 radius
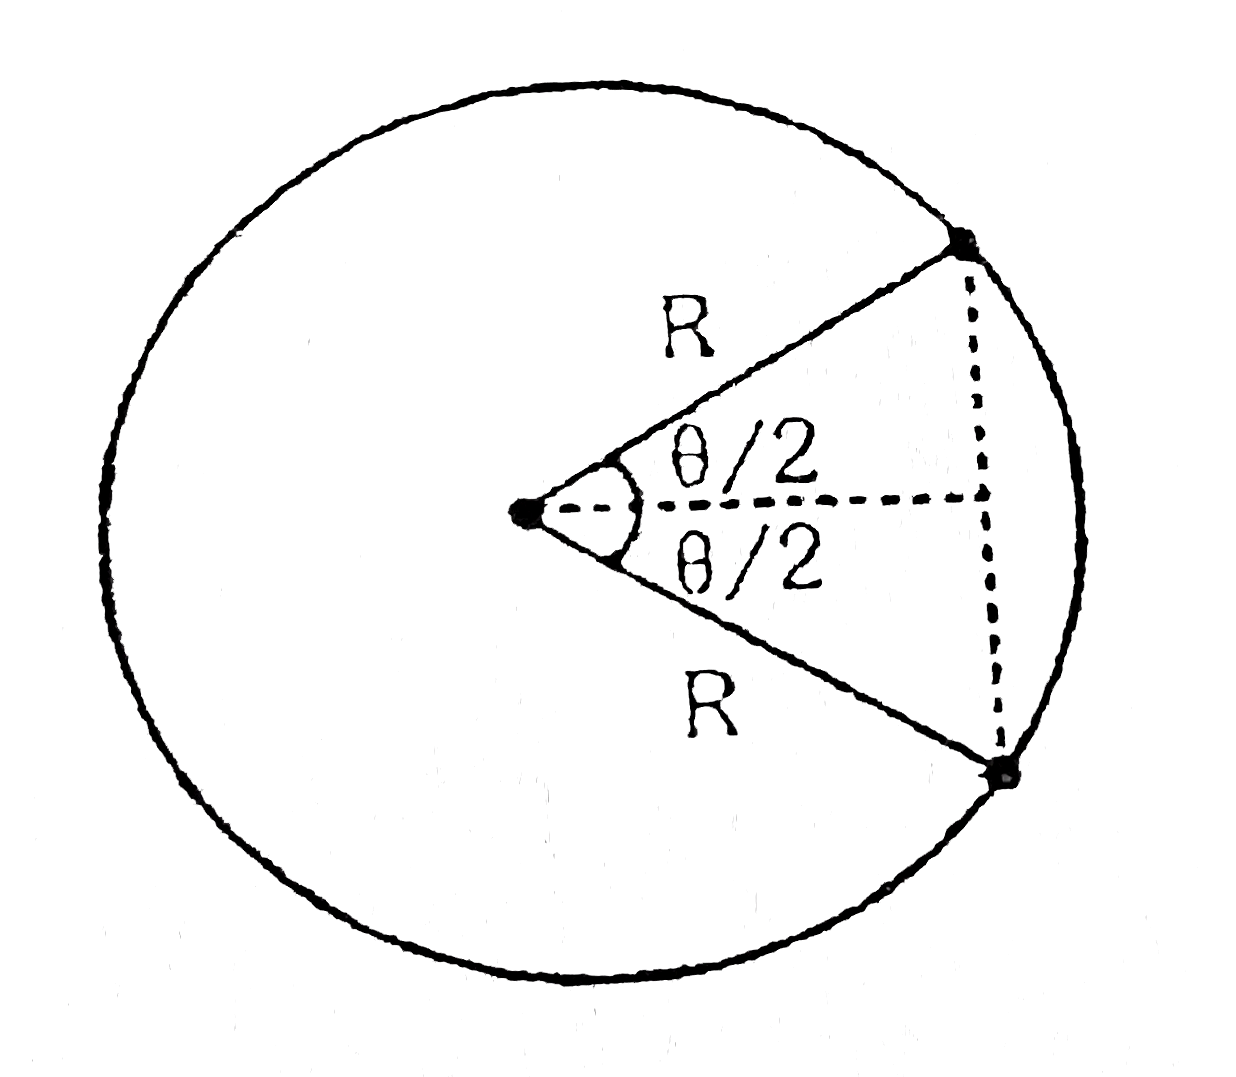
∴ Displacement =2Rsinθ/2=2sin2
Distance =vt=4m
Average velocity =Displacementtime=2sin2
Average acceleration =Change in velocitytime
=2×4sin21=8sin2
Topper's Solved these Questions
- MOTION IN A PALNEBOOK - ALLENCHAPTER - MOTION IN A PALNEEXERCISE - Assertion-Reason
20 Videos
- MOTION IN A PALNEBOOK - ALLENCHAPTER - MOTION IN A PALNEEXERCISE - Comprehension#1
3 Videos
- MOTION IN A PALNEBOOK - ALLENCHAPTER - MOTION IN A PALNEEXERCISE - EXERCISE-02
37 Videos
- KINEMATICS-2DBOOK - ALLENCHAPTER - KINEMATICS-2DEXERCISE - Exercise (O-2)
46 Videos
- NEWTON'S LAWS OF MOTION & FRICTIONBOOK - ALLENCHAPTER - NEWTON'S LAWS OF MOTION & FRICTIONEXERCISE - EXERCISE (JA)
4 Videos
Similar Questions
Velocity-time (v-t) graph for a moving object is shown in the figure. Total displacement of the object during the time interval when there is non-zero acceleration and retardation is

View SolutionVelocity -time (v-t) graph for a moving object is shown in the figure .Total displacement of the object during the time interval when there is non-zero acceleration and reatardation is
View Solutionvelocity time graph of a particle is shown in figure. Find displacement of the particle.
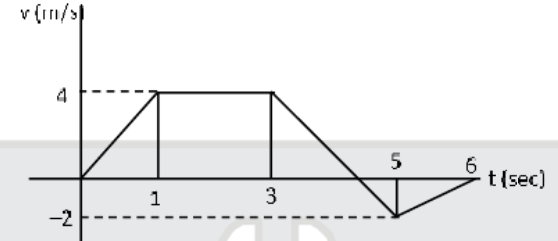
View SolutionThe v-t plot of a moving object ios shown in the figure. The average velocity of the object during the first 10 s is
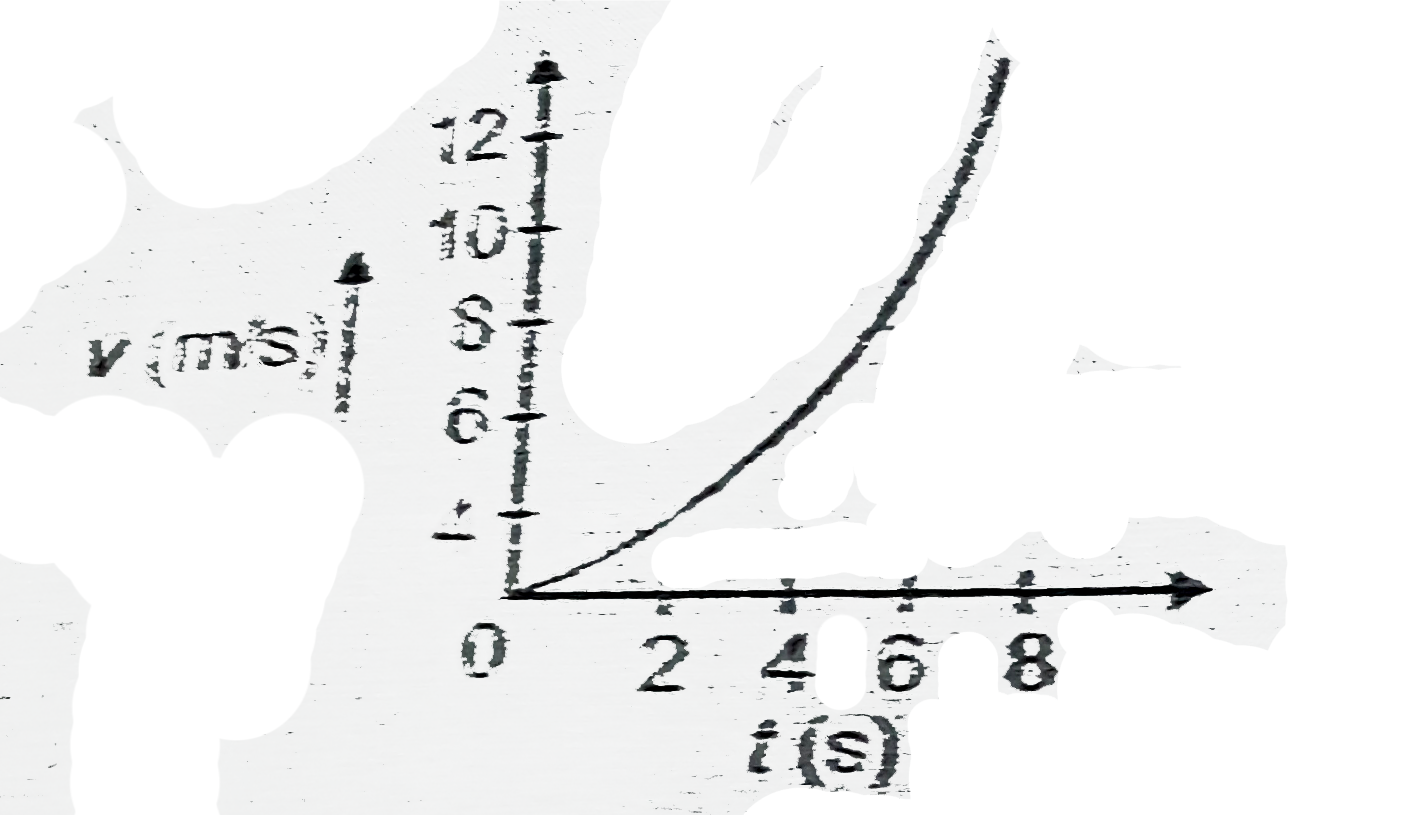
View SolutionThe velocity-time graph of an object is given below. Calculate the average acceleration of the object in the time interval of 4 s to 6 s.
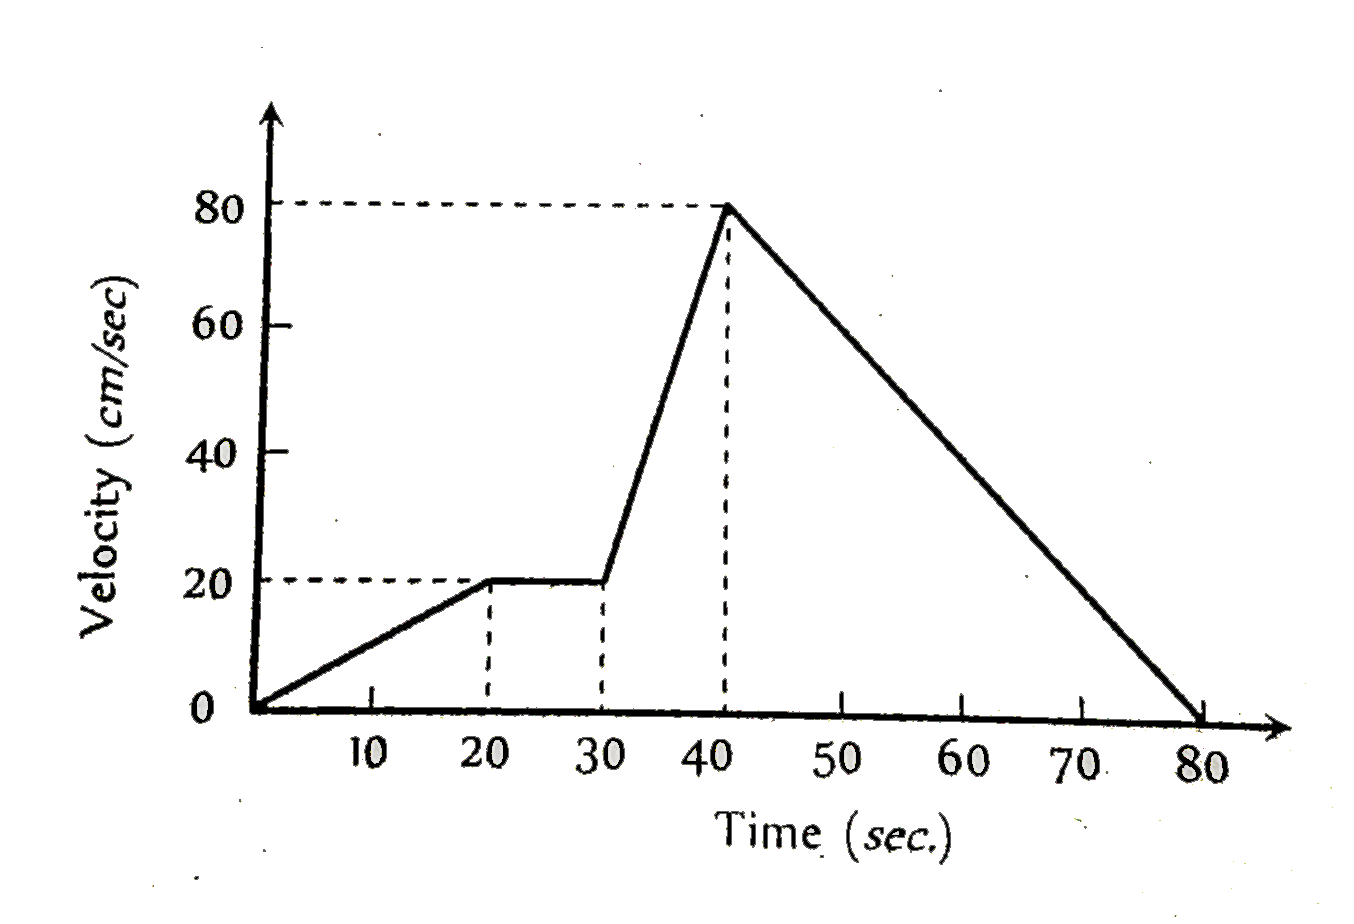
View SolutionThe v−t graph of a moving object is given in figure. The maximum acceleration is
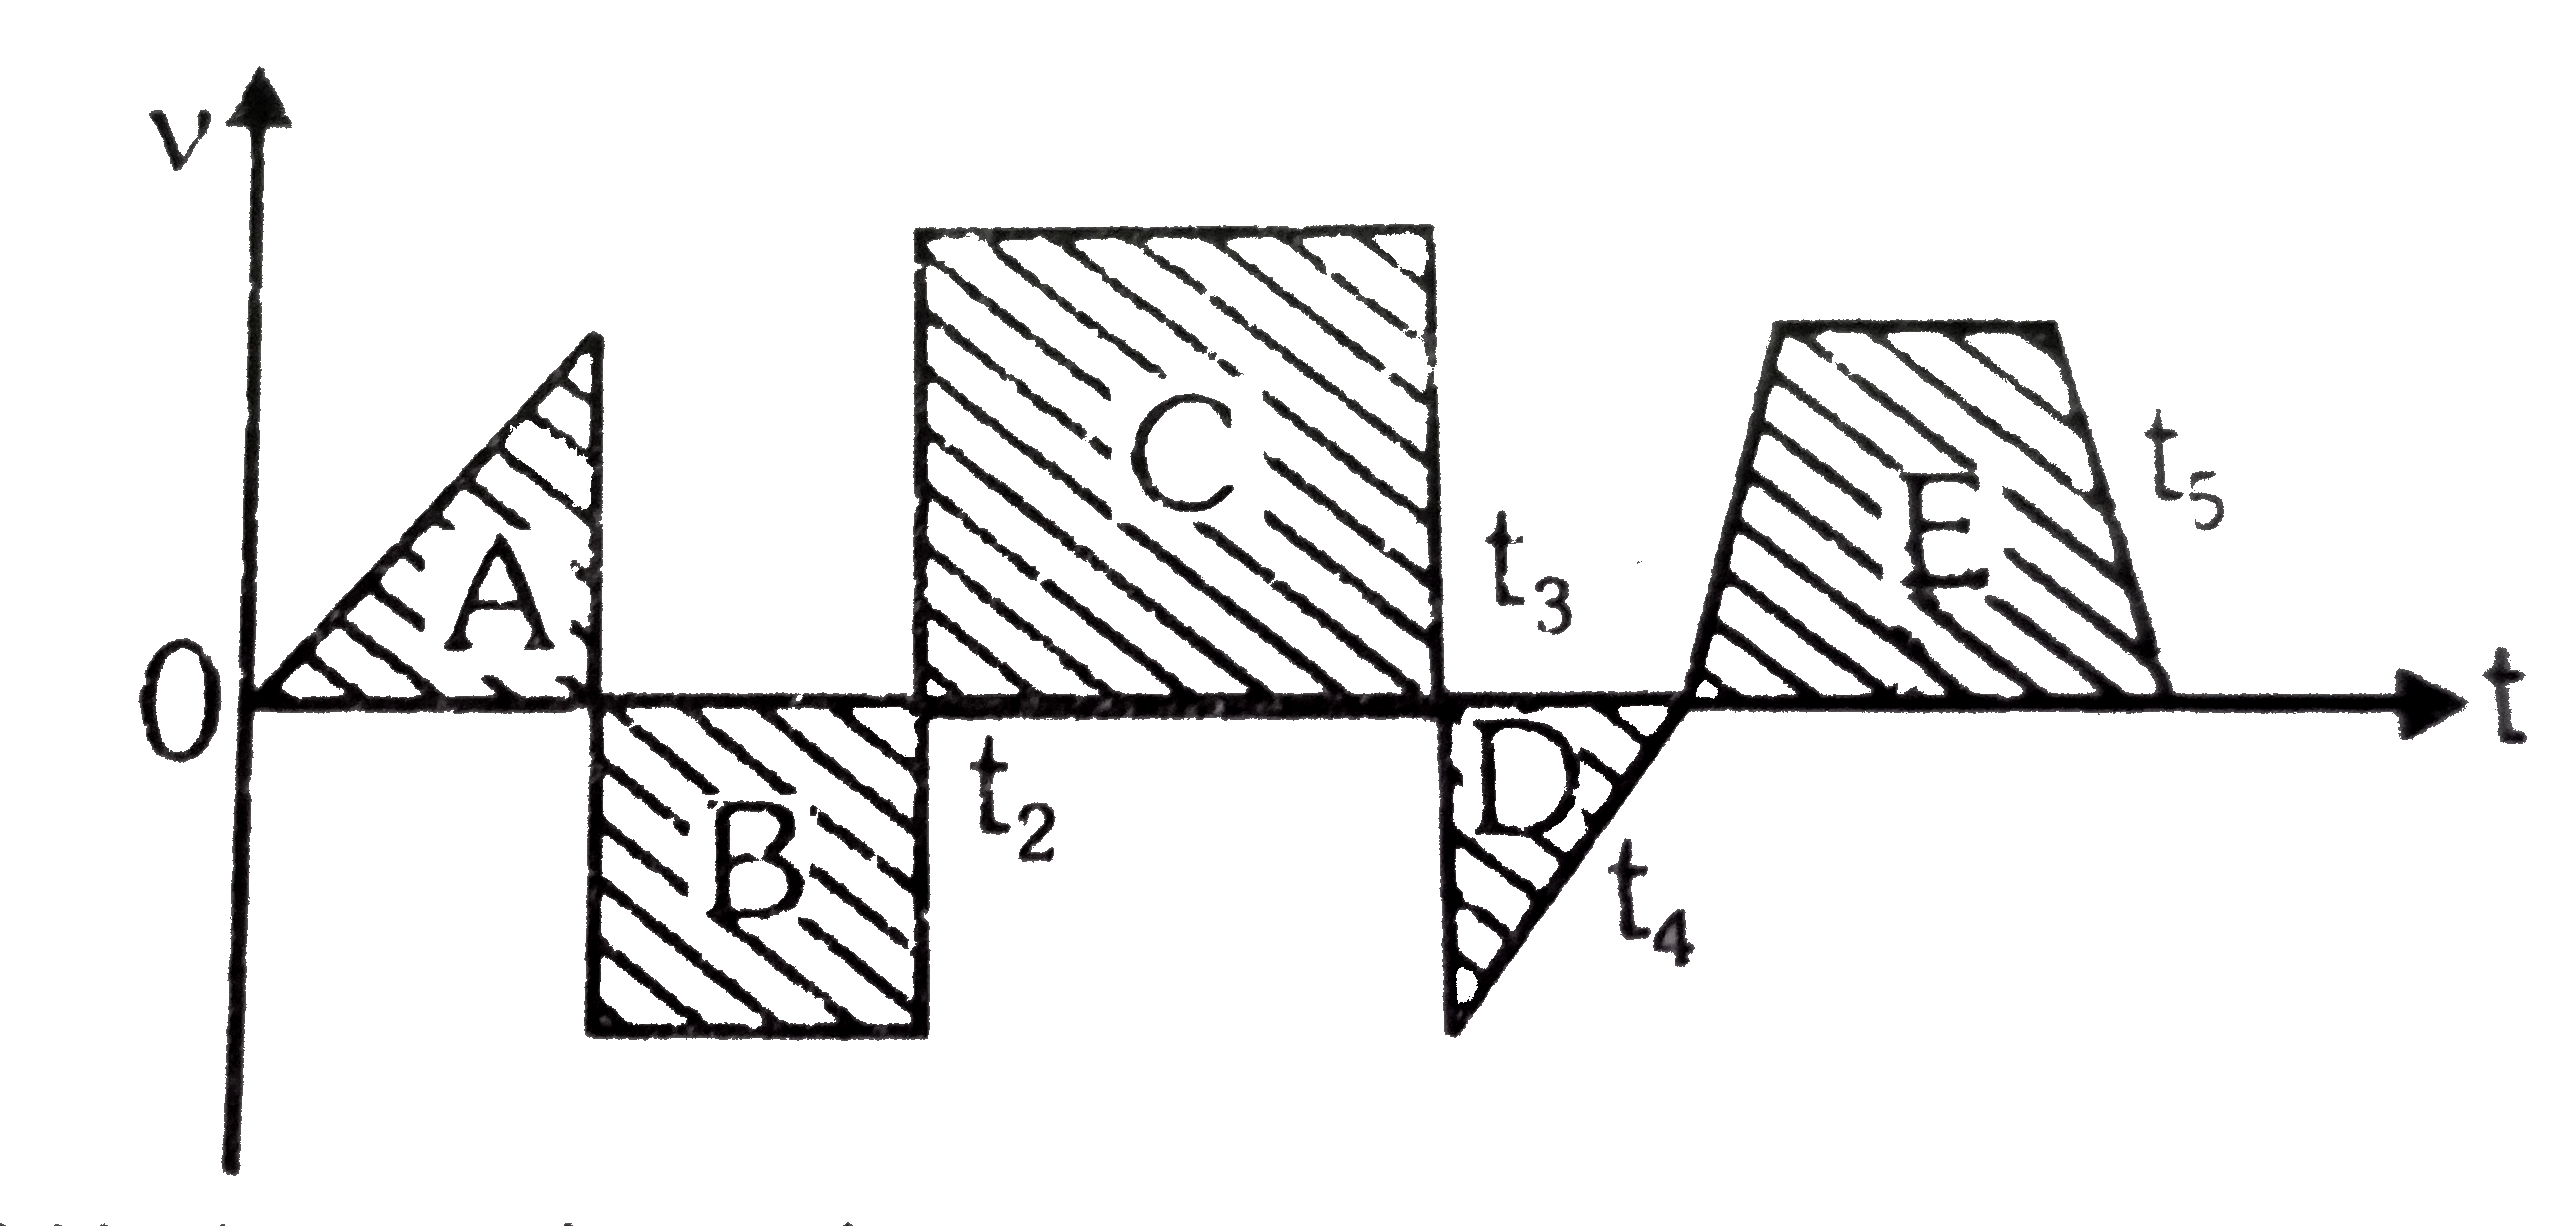
View SolutionThe velocity-time graph of an objects is as shown. The displacement during the interval 0 to t4 is
View SolutionThe velocity-time graph of an object is shown below. The acceleration of the object is
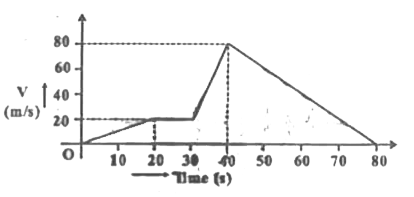
View SolutionThe velocity-time graph of a moving object is given in the figure. Draw the acceleration versus time and displacement versus time graph. Find the distance travelled during the time interval when the acceleration is maximum . Assume that the particle starts from origin.
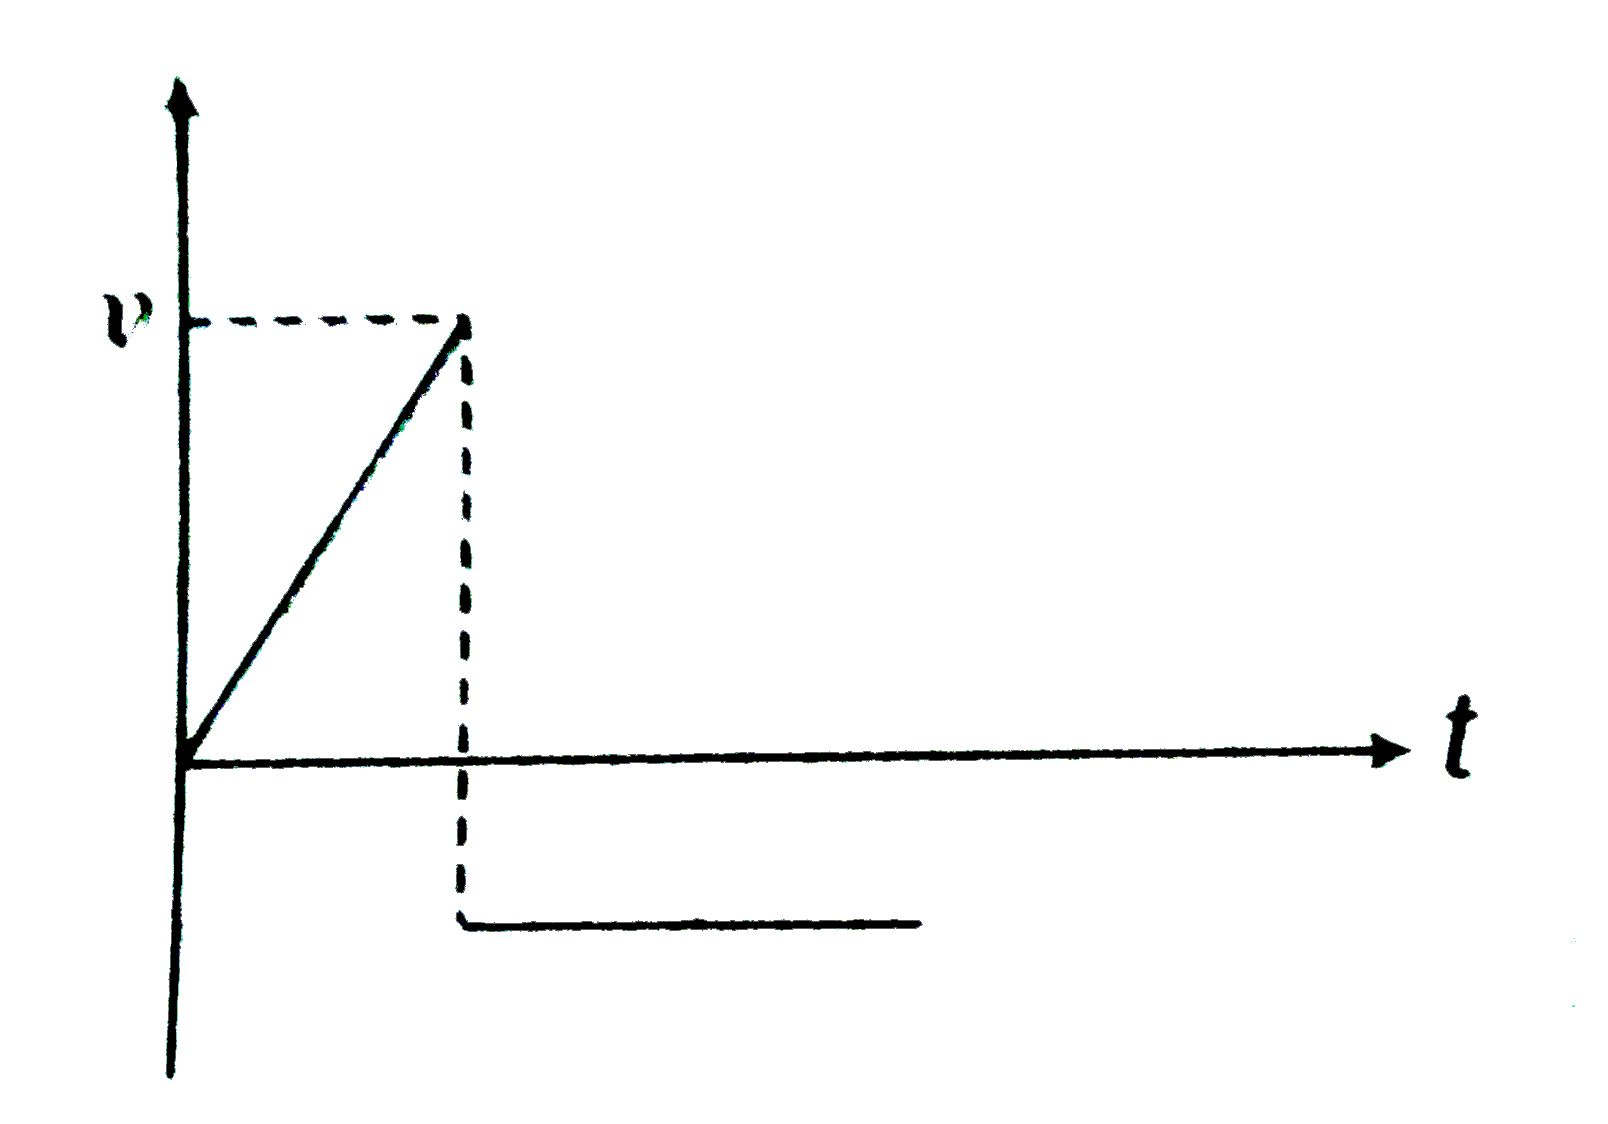
View SolutionThe velocity-time graph for a particle moving along X-axis is shown in the figure. The corresponding displacement-time graph is correctly shown by
View Solution
