The load versus elongation graph for four wires of the same material is shown in the figure. The thickest wire is represented by the line
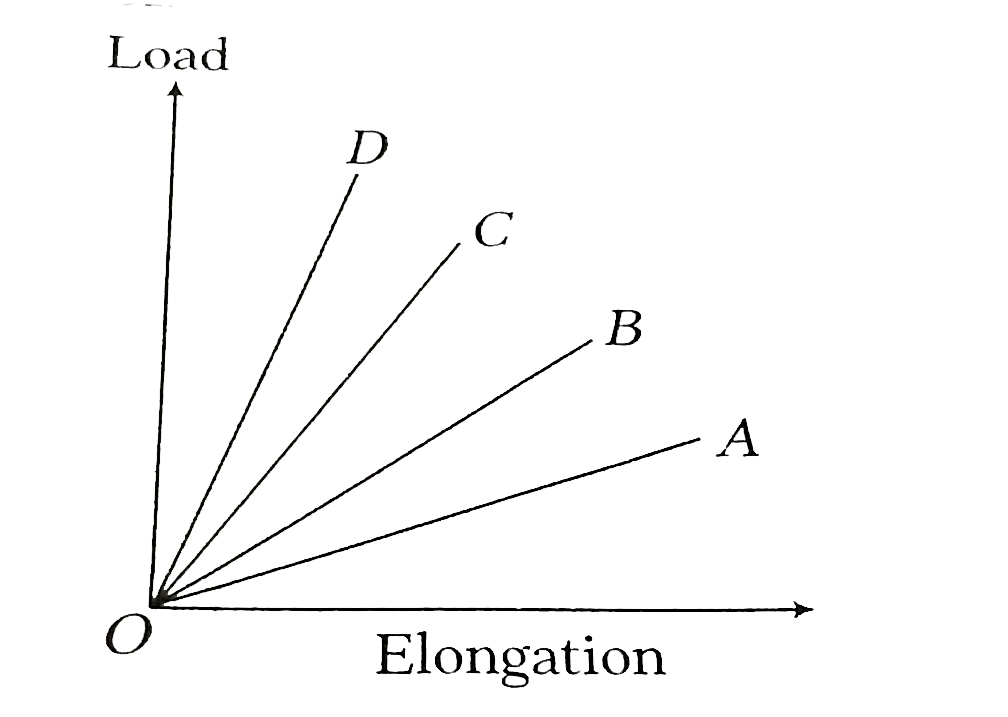
OB
OA
OD
OC
Step by step video & image solution for The load versus elongation graph for four wires of the same material is shown in the figure. The thickest wire is represented by the line by Physics experts to help you in doubts & scoring excellent marks in Class 12 exams.
Updated on:21/07/2023Topper's Solved these Questions
- RACEBook:ALLENChapter:RACEExercise:Basic Maths (Trigonometry)
Explore 22 Videos
- RACEBook:ALLENChapter:RACEExercise:Basic Maths (Differentiation)
Explore 38 Videos
- RACEBook:ALLENChapter:RACEExercise:Race 21
Explore 5 Videos
- NEWTONS LAWS OF MOTIONBook:ALLENChapter:NEWTONS LAWS OF MOTIONExercise:EXERCISE-III
Explore 28 Videos
- SIMPLE HARMONIC MOTIONBook:ALLENChapter:SIMPLE HARMONIC MOTIONExercise:Example
Explore 1 Video
Similar Questions
_E01_007_Q01.png)
The load versus elongation graph for four wires of the same material and same length is shown in the figure. The hinnest wire is represented by the line
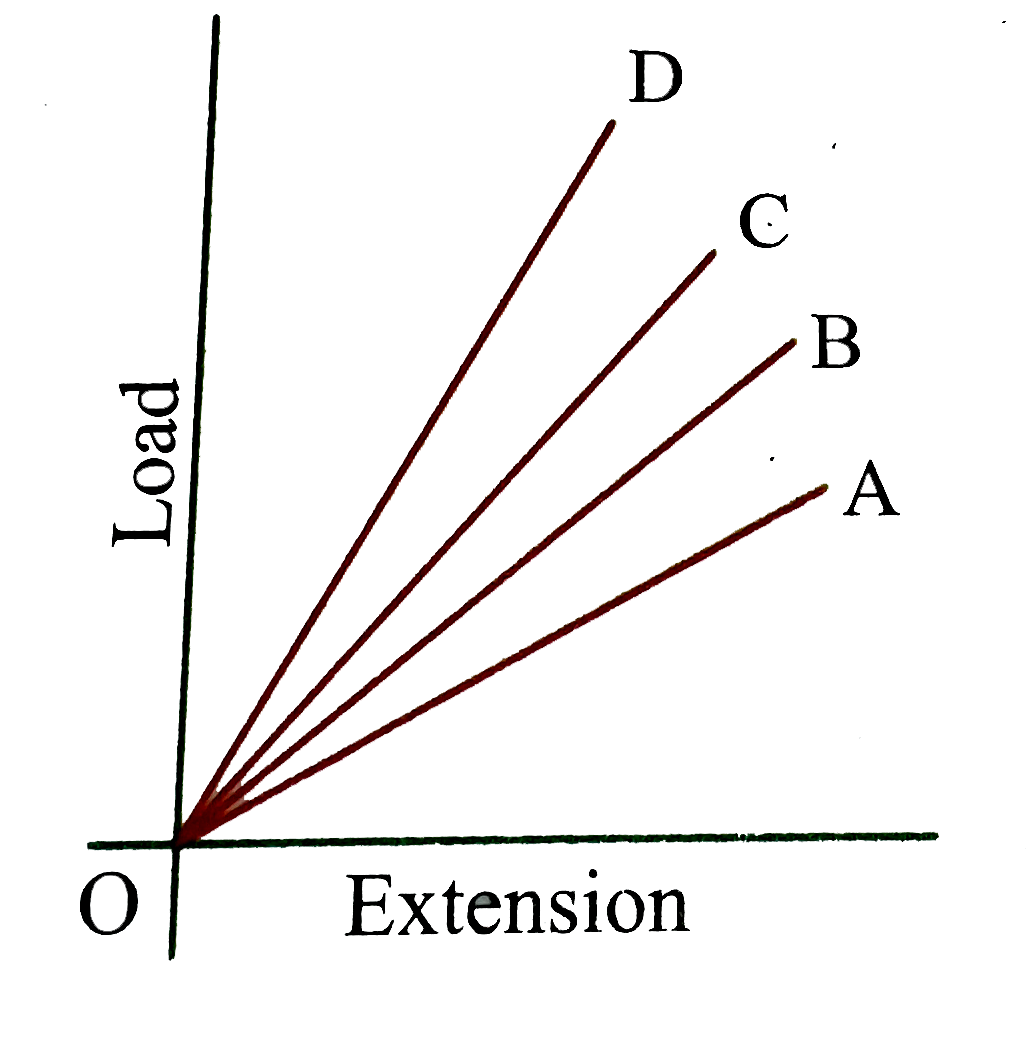
View SolutionThe load versus extension graph for four wires of same material is shown.
The thinnest wire is represented by the line
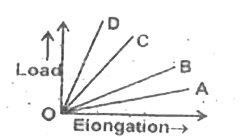
View SolutionThe load versus elongatino graphs for four wires A,B,C and D of the same material and equal lenghts are shown in the figure . The thickest wire is represented by the fine
View SolutionThe pointer reading versus load graph for a spring balance is as shown in the figure.
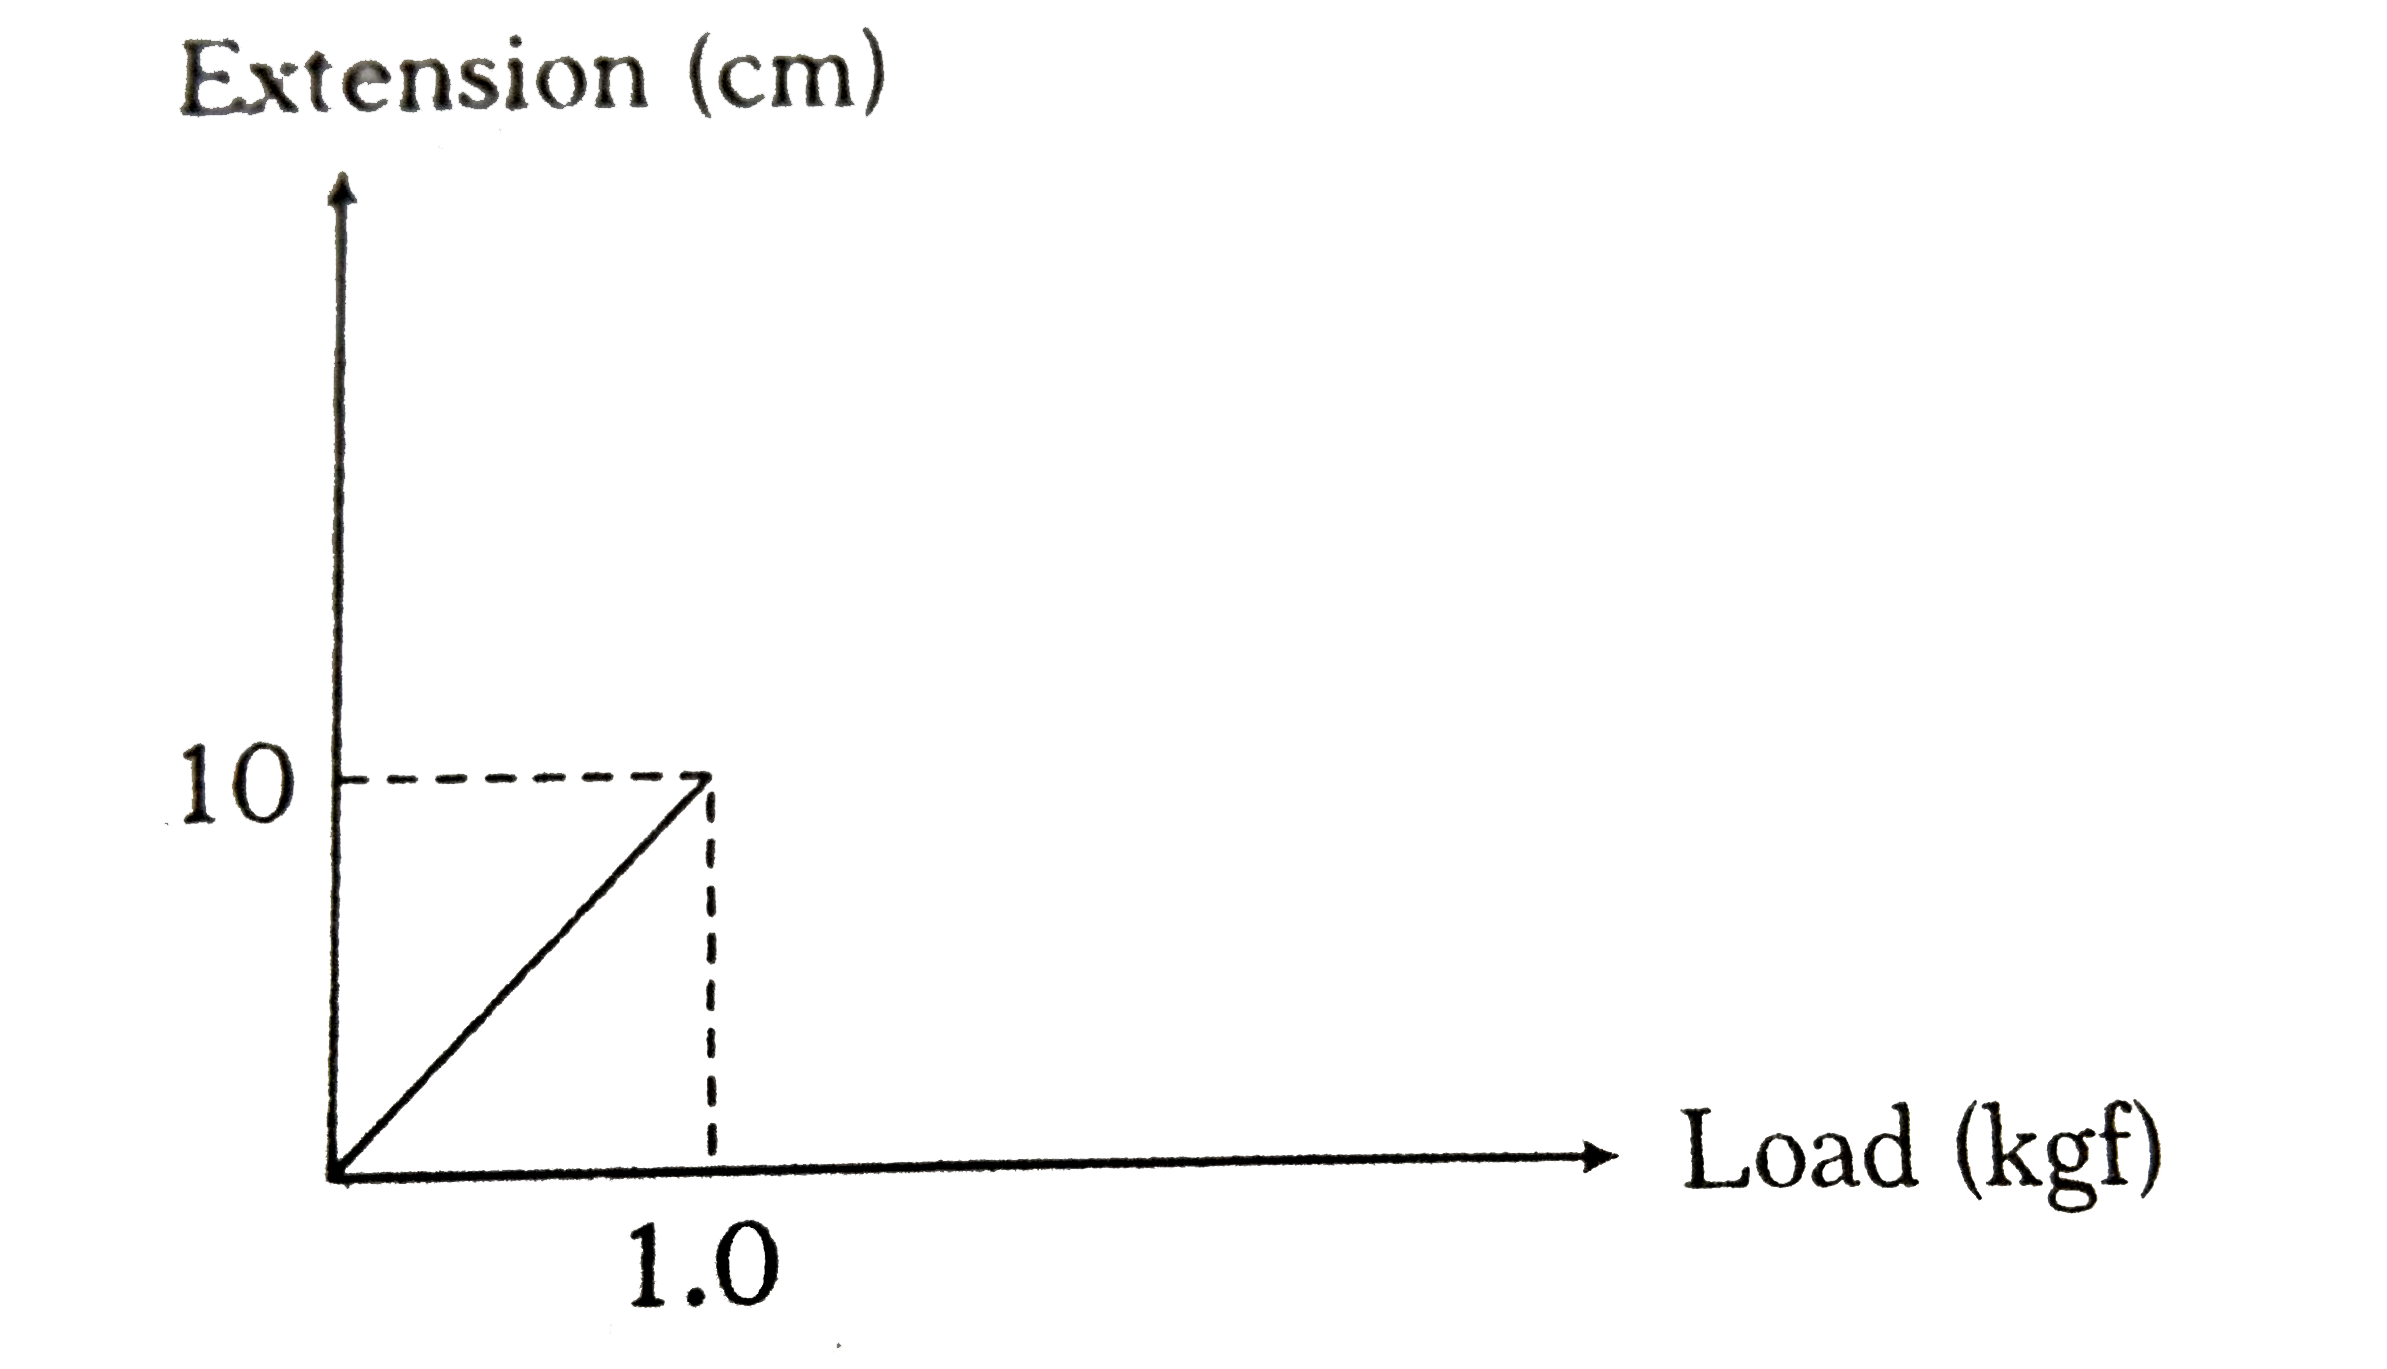
The spring constant is
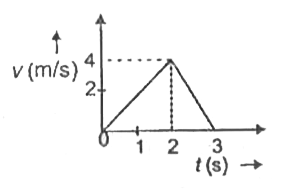
View SolutionThe velocity versus time graph of a body moving in a straight line is as shown in the figure below
View SolutionThe stress versus strain graphs for wires of two materials A and B are as shown in the figure. If YAandYB are the younng's moduli of the materials, then
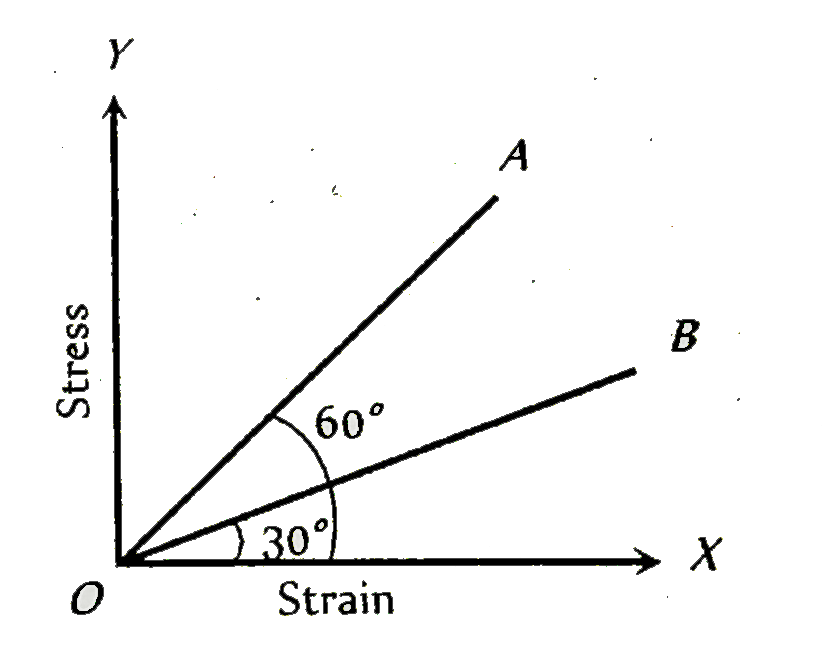
View SolutionThe stress versus strain graphs for wires of two materials A and B are as shown in the figure. If YAandYB are the younng's moduli of the materials, then

View SolutionThe dimensions of four wires of the same material an given below. In which wire the increase in the length will be maximum?
View SolutionThe x-t graph shown in figure represents

View SolutionThe kinetic energy (KE) versus time graph for a particle moving along a straight line is as shown in the figure. The force versus time graph for the particle may be

View Solution
