The pressure and volume of a gas are changed as shown in the p-V diagram in the figrue ahead. The thmperature of the gas
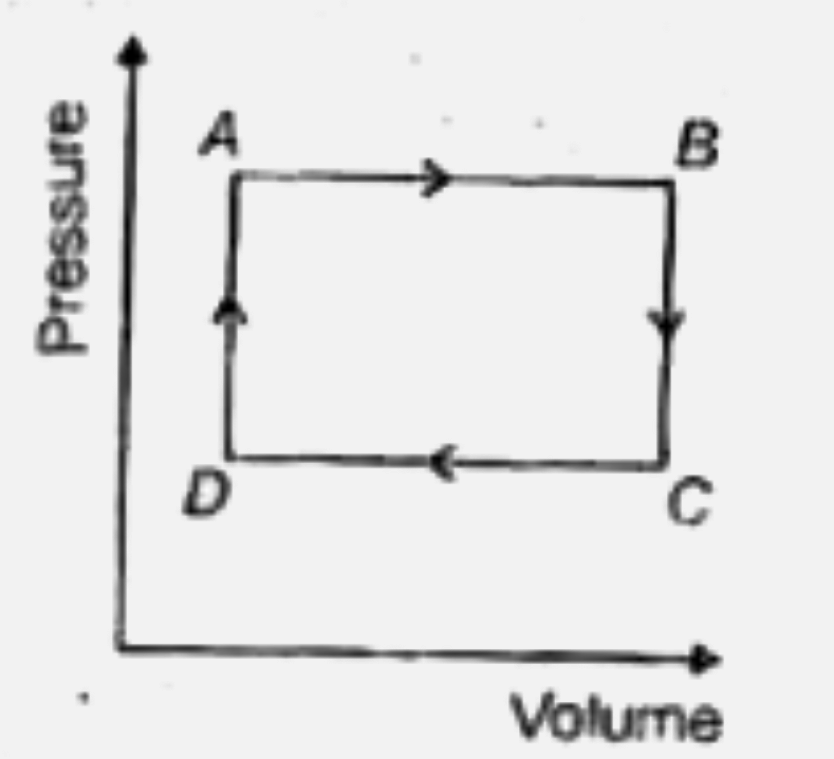
Increases as it goes from A to B
Increases as it goes from B to C
Remains constant during these changes
Decreases as it goes from D to A
The correct Answer is:A
Step by step video & image solution for The pressure and volume of a gas are changed as shown in the p-V diagram in the figrue ahead. The thmperature of the gas by Physics experts to help you in doubts & scoring excellent marks in Class 12 exams.
Updated on:21/07/2023Topper's Solved these Questions
- RACEBOOK - ALLENCHAPTER - RACEEXERCISE - Basic Maths (Dscillations) (Kinematics of SHM)
20 Videos
- RACEBOOK - ALLENCHAPTER - RACEEXERCISE - Basic Maths (Oscillations) (Energy & spring pendulum)
17 Videos
- RACEBOOK - ALLENCHAPTER - RACEEXERCISE - Basic Maths (Thermal Physics) (Kinetic theory of gasess)
12 Videos
- NEWTONS LAWS OF MOTIONBOOK - ALLENCHAPTER - NEWTONS LAWS OF MOTIONEXERCISE - EXERCISE-III
28 Videos
- SIMPLE HARMONIC MOTIONBOOK - ALLENCHAPTER - SIMPLE HARMONIC MOTIONEXERCISE - Example
1 Videos
Similar Questions
The pressure P and volume V of an ideal gas both decreases in a process.
View SolutionOne mole of an ideal monotomic gas undergoes a linear process from A to B in which its pressure p and its volume V change as shown in figure.
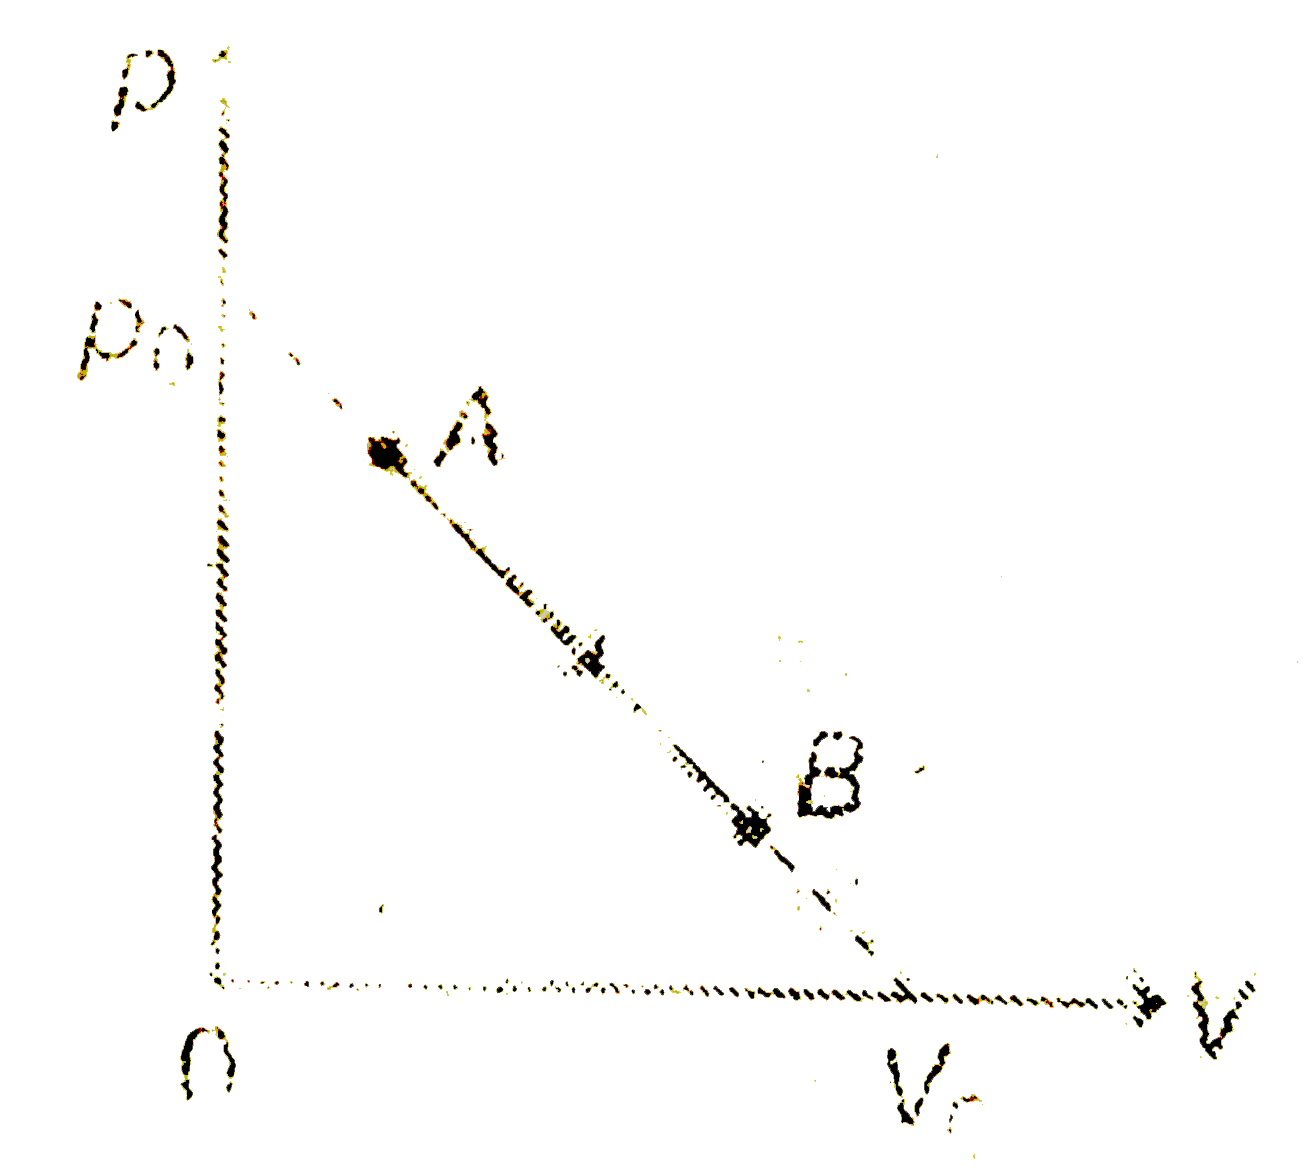
The maximum temperature of the gas during this process is
View SolutionThe pressure p and volume V of an ideal gas both increase in a process.
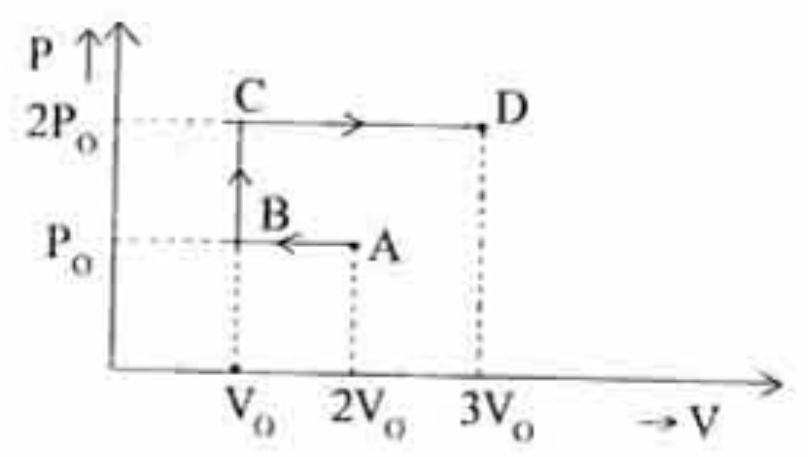
View SolutionThe work done by the gas in the process shown in given P-V diagram is
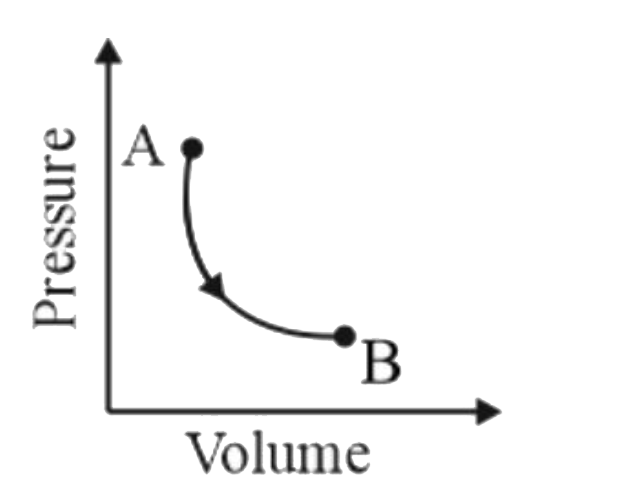
View SolutionThe pressure and volume of an ideal gas are related as pα1v2 for process A→B as shown in figure . The pressure and volume at A are 3p0andv0 respectively and pressure B is p0 the work done in the process A→B is found to be [x−√3]p0v0 find
View SolutionA diatomic ideal gas undergoes a thermodynamic change according to the P-V diagram shown in the figure. The total heat given to the gas is nearly ( use ln2=0.7):
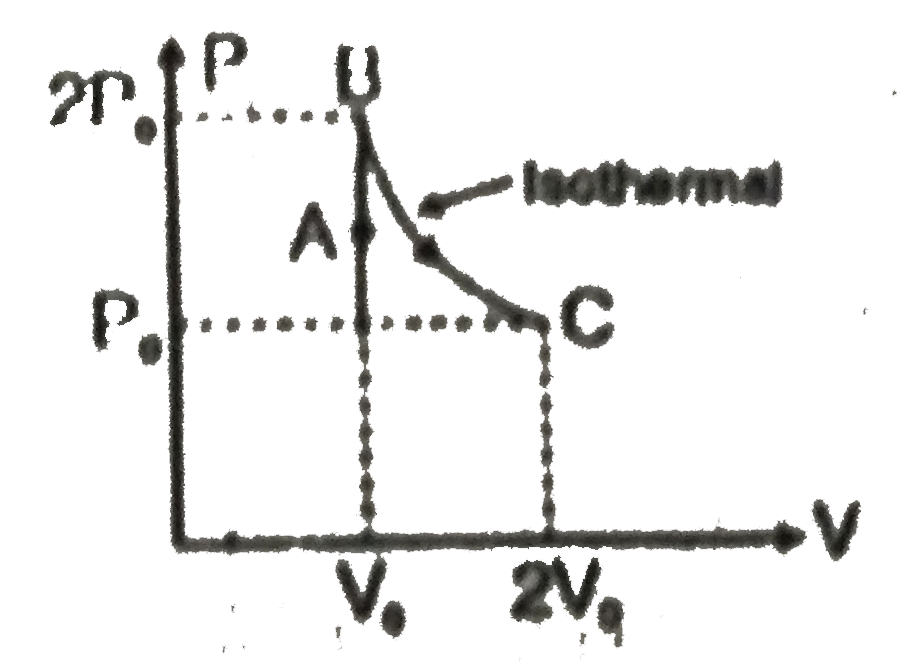
View SolutionA diatomic ideal gas undergoes a thermodynamic change according to the P-V diagram shown in the figure. The total heat given to the gas is nearly ( use ln2=0.7):

View SolutionAn ideal gas in a thermally insulated vessel at internal pressure =P1, volume =V1 and absolute temperature =T1 expands irreversibly against zero external pressure, as shown in the diagram. The final internal pressure, volume and absolute temperature of the gas are P2,V2 and T2 respectively. For this expansion.
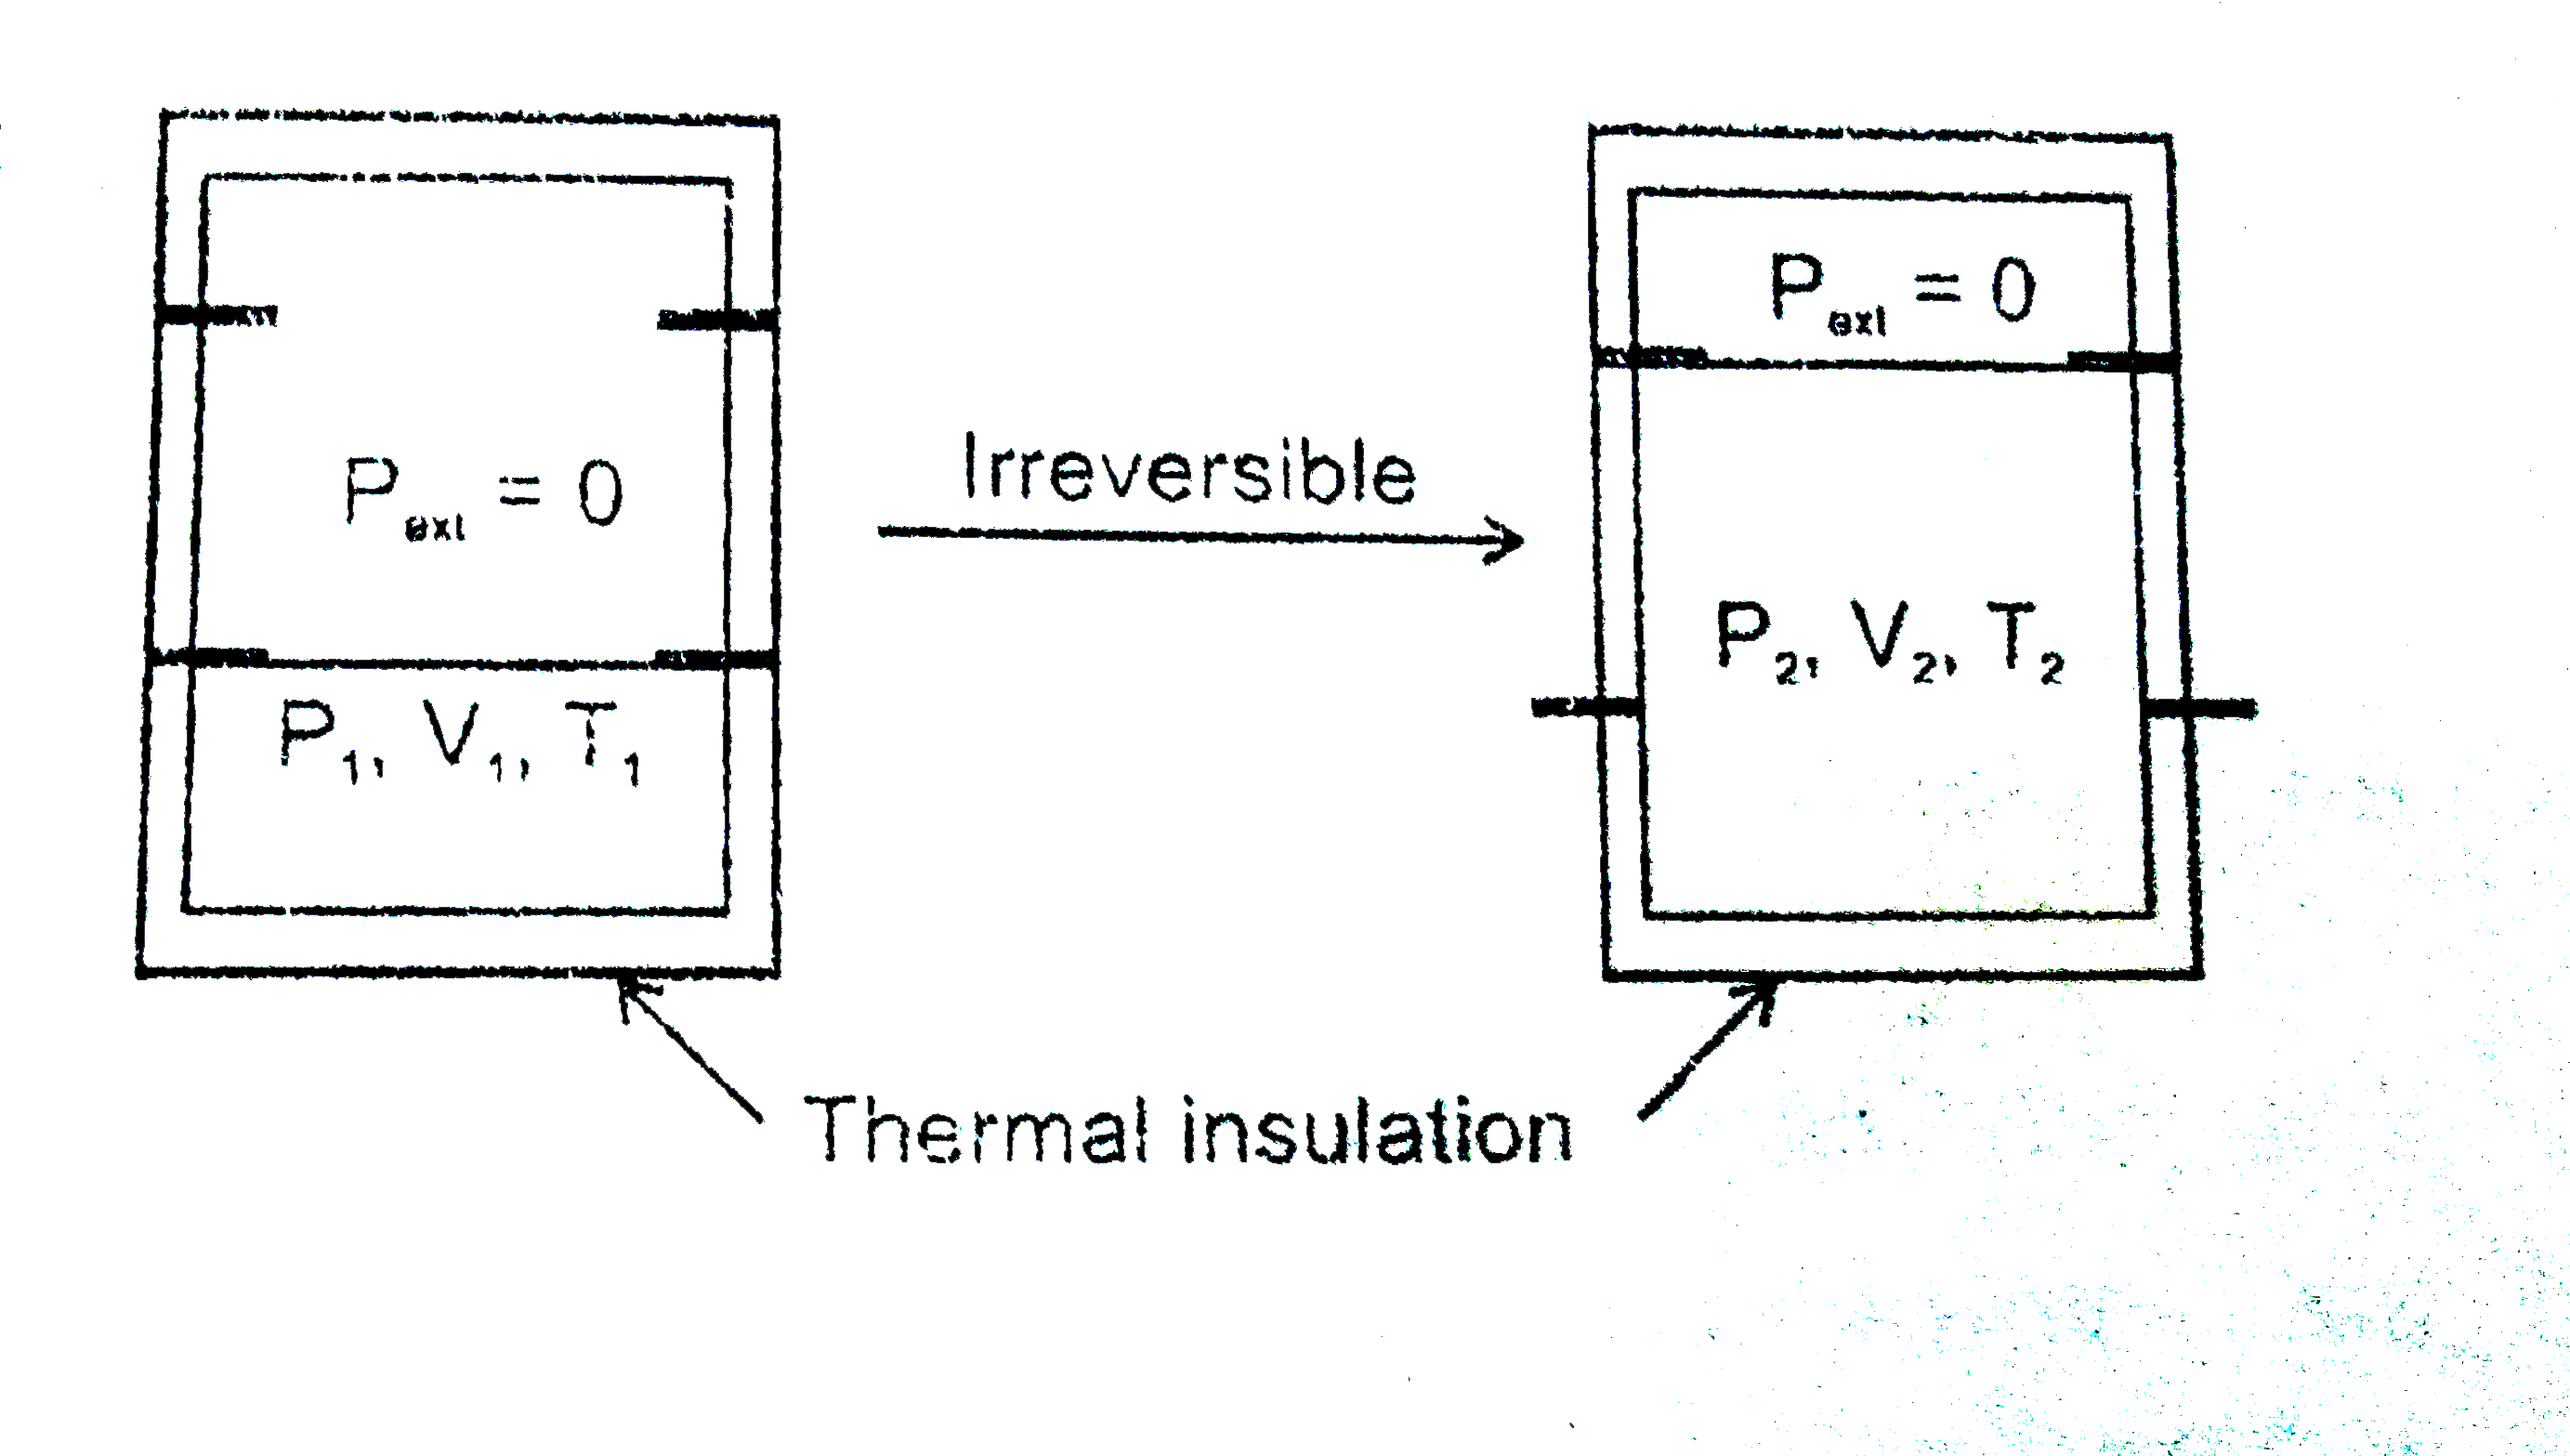
View SolutionAn ideal gas in a thermally insulated vessel at internal pressure =P1, volume =V1 and absolute temperature =T1 expands irreversibly against zero external pressure, as shown in the diagram. The final internal pressure, volume and absolute temperature of the gas are P2,V2 and T2 respectively. For this expansion.

View SolutionAn ideal gas in a thermally insulated vessel at internal pressure = P1, volume =V1 and absolute temperature =T1 expands irreversibly against zero external pressure, as shown in the diagram. The final internal pressure, volume and absolute temperature of the gas are P2,V2andT2, respectively. For this expansion.
View Solution
