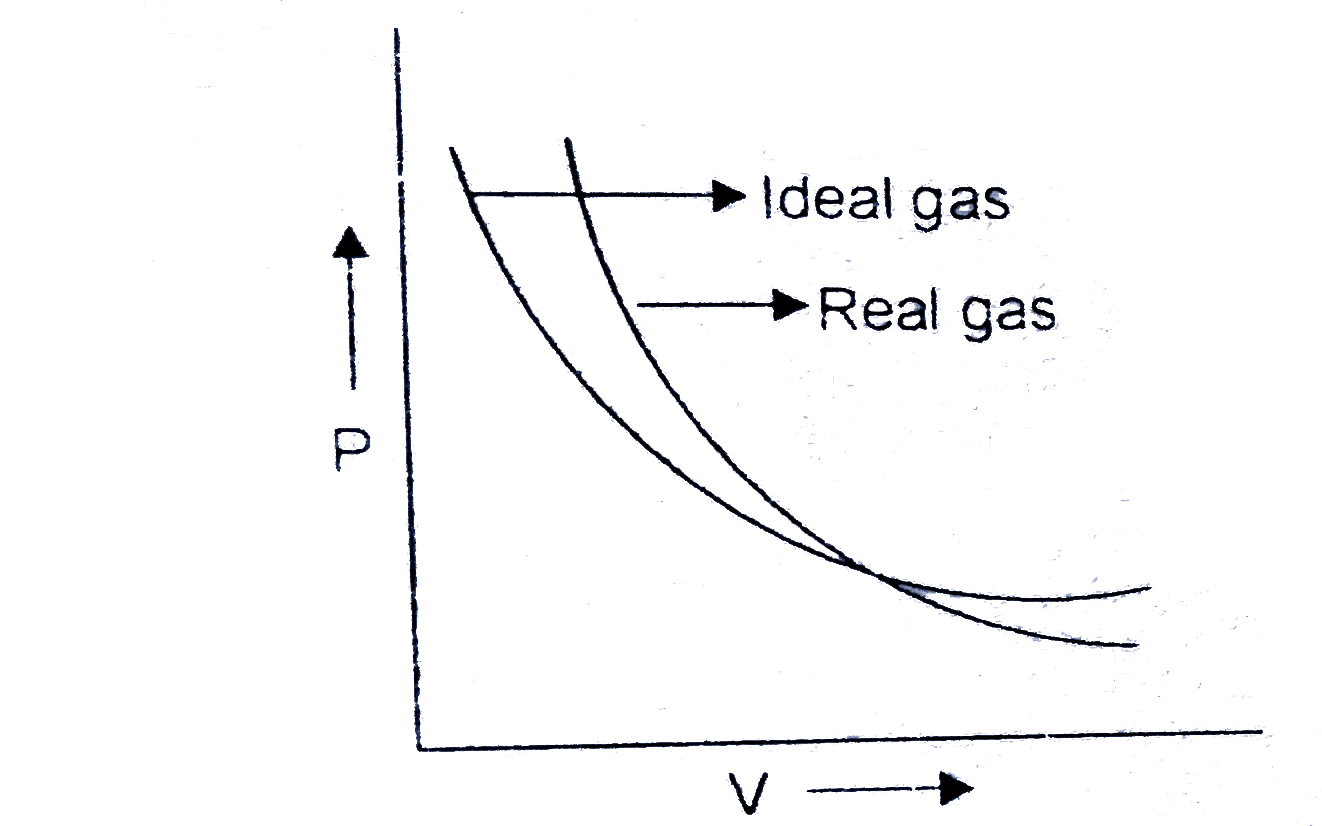
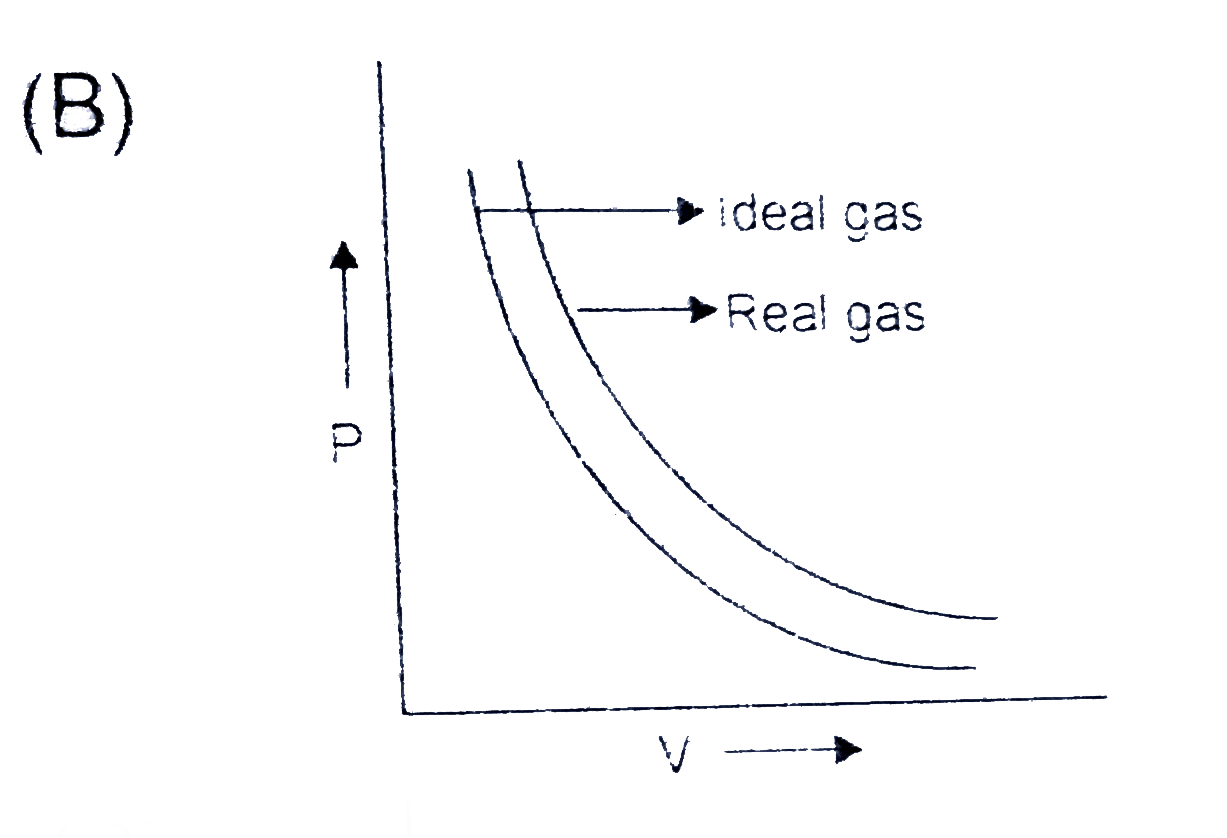
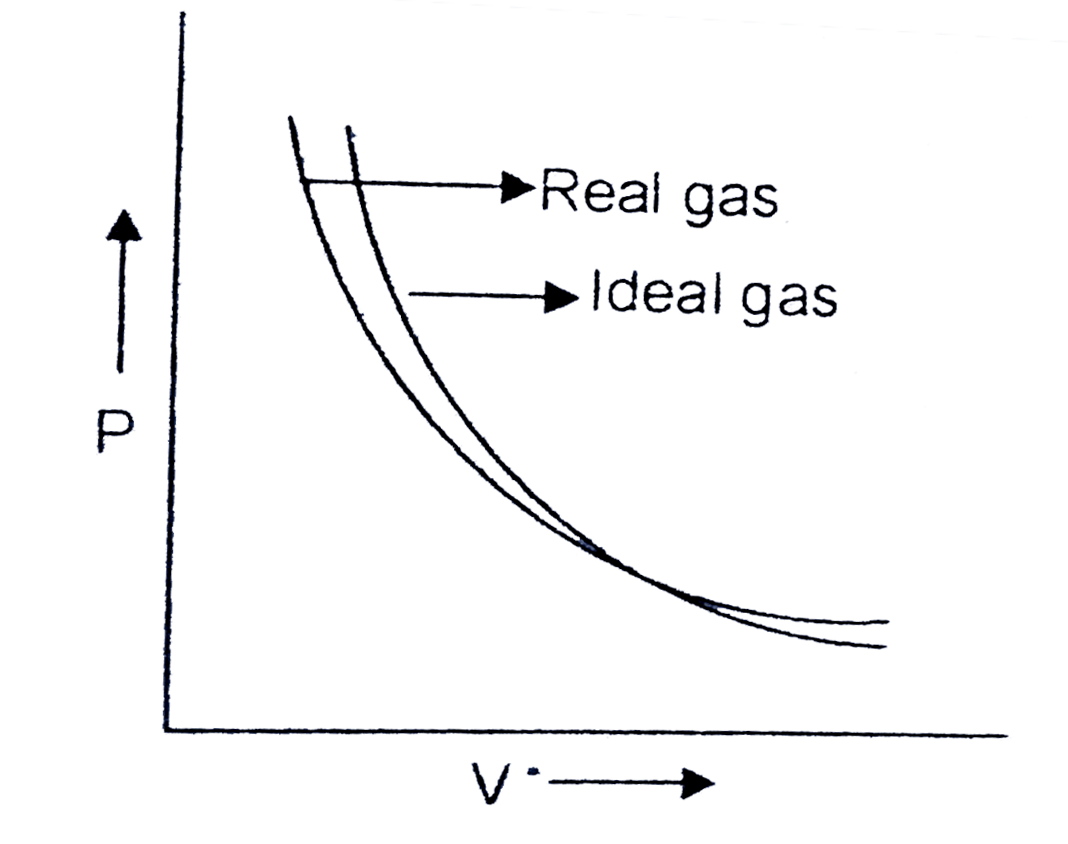
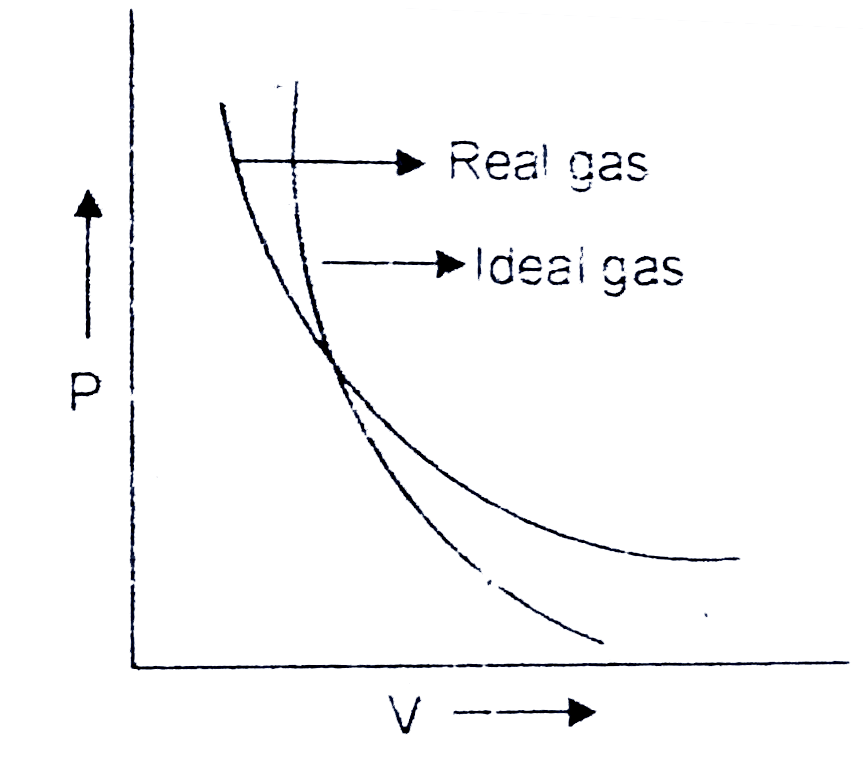
Which of the following graph is correct for real gases other than hydrogen and helium at 0∘ ?
The correct Answer is:C
To determine the correct graph for real gases other than hydrogen and helium at 0°C, we need to understand the behavior of real gases compared to ideal gases under different conditions.
1. Understanding Ideal vs. Real Gases:
- Ideal gases follow the ideal gas law perfectly under all conditions. They have no intermolecular forces and occupy no volume.
- Real gases deviate from this behavior, especially at high pressures and low temperatures, due to intermolecular forces and the finite volume of gas molecules.
2. Behavior of Real Gases at 0°C:
- At 0°C, real gases will not behave perfectly like ideal gases. They will show deviations from the ideal gas law.
- Real gases behave more like ideal gases at high temperatures and low pressures. At low temperatures and high pressures, they deviate significantly.
3. Graphical Representation:
- The graph typically plots pressure (P) on the y-axis and volume (V) on the x-axis.
- For ideal gases, the graph is linear, indicating that pressure is inversely proportional to volume (PV = constant).
- For real gases, at low temperatures and moderate pressures, the graph will show a curve that deviates from the ideal gas line.
4. Analyzing the Options:
- Option A: If the ideal gas line is behind the real gas line, it suggests that the real gas behaves better than the ideal gas, which is incorrect.
- Option B: If both lines are parallel, it implies that real gases behave exactly like ideal gases, which is not true at low temperatures.
- Option C: This option shows real gas behavior deviating from ideal gas behavior, which is expected at 0°C.
- Option D: Similar to option A, it implies incorrect behavior.
5. Conclusion:
- The correct graph for real gases other than hydrogen and helium at 0°C is Option C, as it accurately represents the deviation of real gases from ideal behavior.
- Ideal gases follow the ideal gas law perfectly under all conditions. They have no intermolecular forces and occupy no volume.
- Real gases deviate from this behavior, especially at high pressures and low temperatures, due to intermolecular forces and the finite volume of gas molecules.
- At 0°C, real gases will not behave perfectly like ideal gases. They will show deviations from the ideal gas law.
- Real gases behave more like ideal gases at high temperatures and low pressures. At low temperatures and high pressures, they deviate significantly.
- The graph typically plots pressure (P) on the y-axis and volume (V) on the x-axis.
- For ideal gases, the graph is linear, indicating that pressure is inversely proportional to volume (PV = constant).
- For real gases, at low temperatures and moderate pressures, the graph will show a curve that deviates from the ideal gas line.
- Option A: If the ideal gas line is behind the real gas line, it suggests that the real gas behaves better than the ideal gas, which is incorrect.
- Option B: If both lines are parallel, it implies that real gases behave exactly like ideal gases, which is not true at low temperatures.
- Option C: This option shows real gas behavior deviating from ideal gas behavior, which is expected at 0°C.
- Option D: Similar to option A, it implies incorrect behavior.
- The correct graph for real gases other than hydrogen and helium at 0°C is Option C, as it accurately represents the deviation of real gases from ideal behavior.
Similar Questions
Which of the following is correct for hydrogen?
View SolutionWhich of the following graph is correct for a zero order reaction ?
View SolutionWhich of the following graph is correct for a first order reaction ?
View SolutionWhich of the following graph is correct for zero order reaction?
View SolutionWhich of the following graph is correct for the enzyme catalysis ?
View SolutionWhich is/are correct for real gases?
View SolutionWhich of the following is correct graph for the reaction?
View SolutionWhich of the following statements is/are correct about real gases?
View SolutionWhich of the following option is correct about given graph?
View SolutionWhich of the following statement is correct in relation to the hydrogen atom :
View Solution
