Which of the following graphs regarding Maxwell distribution of speed are correct for ideal gases ?
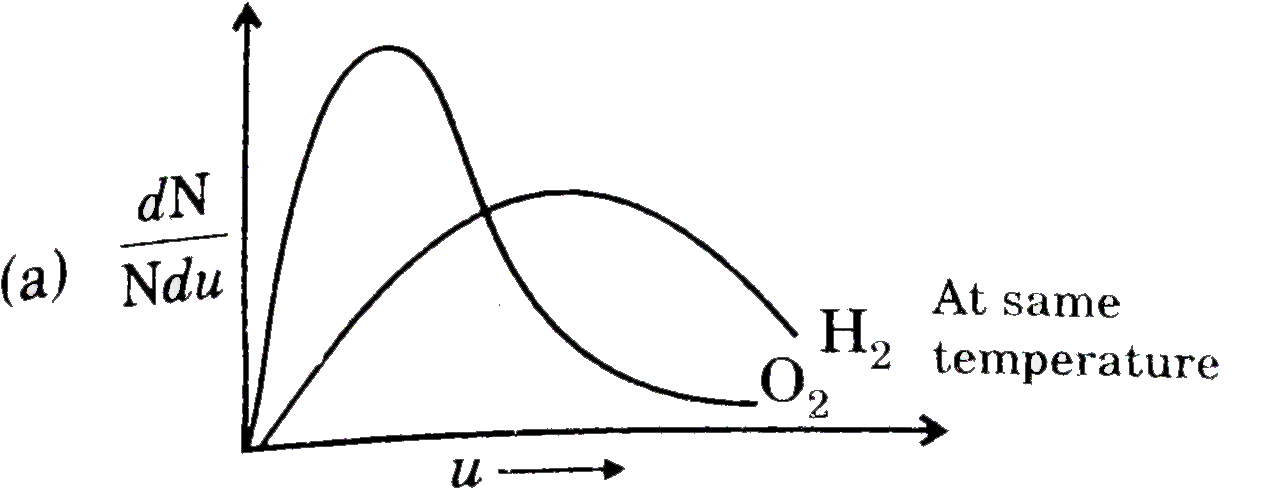
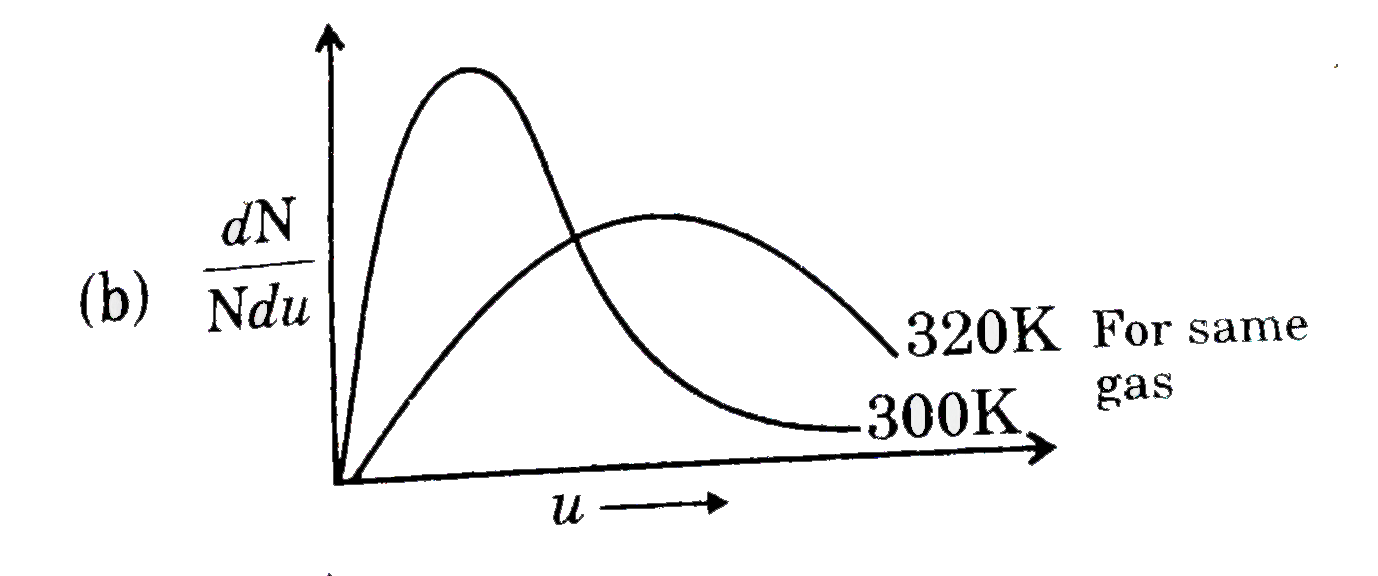
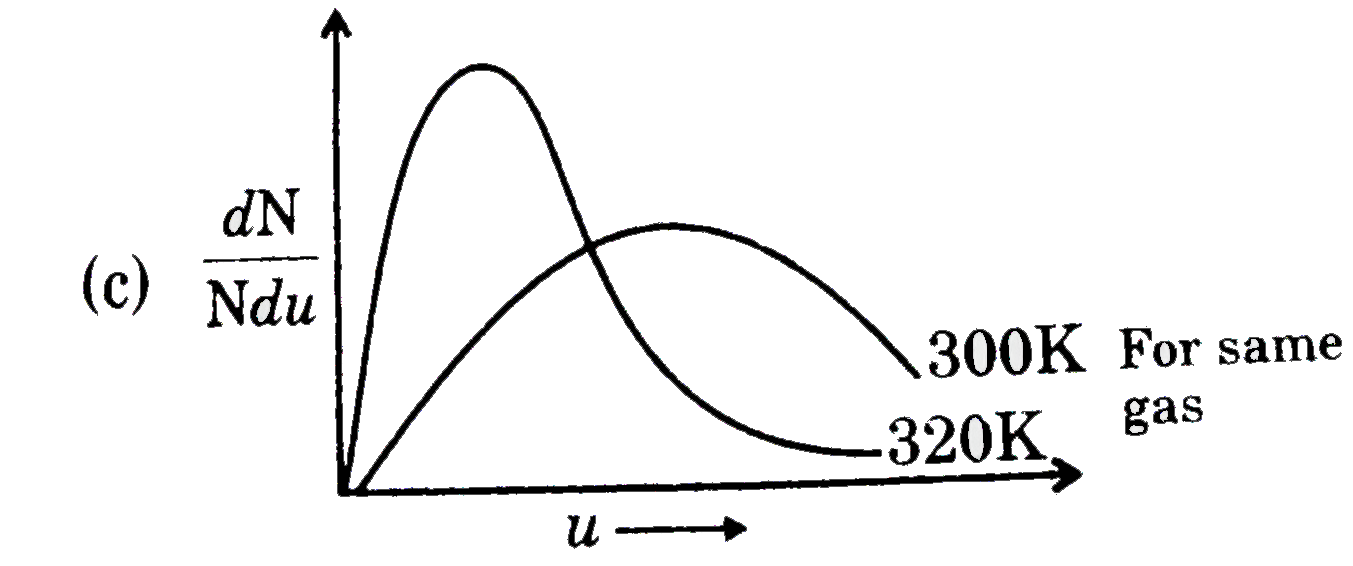
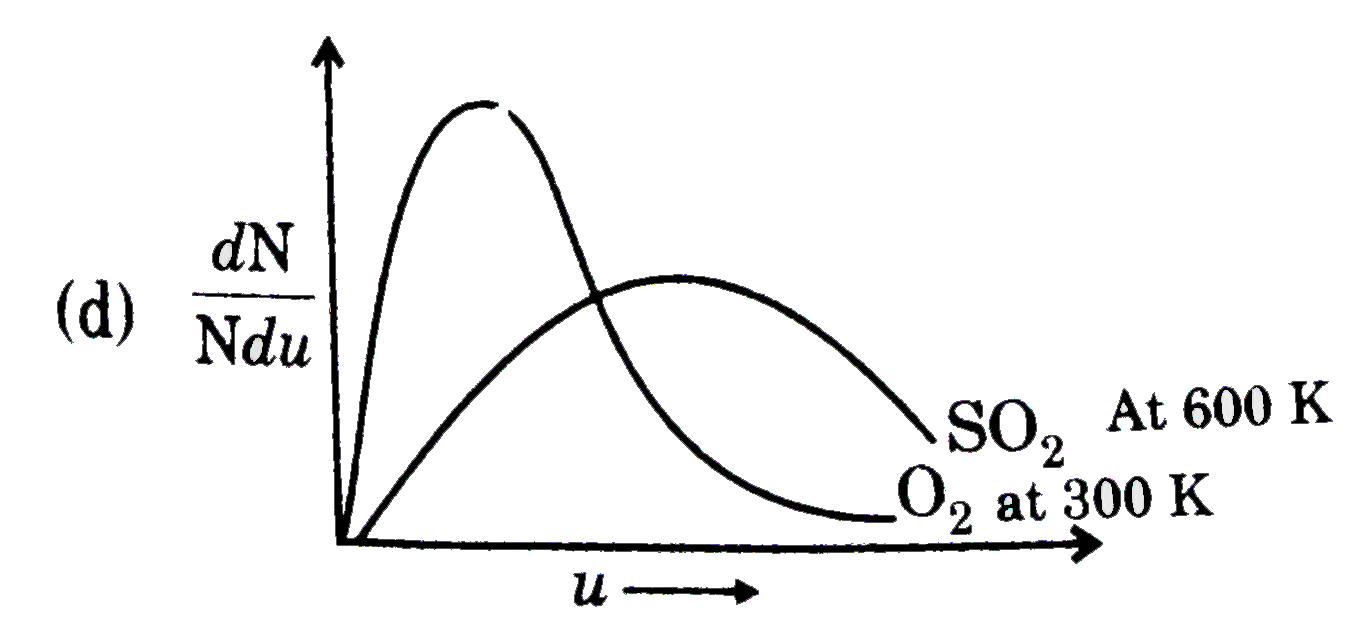
The correct Answer is:A, B
Topper's Solved these Questions
- GRAPHICAL INTERPRETATIONBOOK - GRB PUBLICATIONCHAPTER - GRAPHICAL INTERPRETATIONEXERCISE - Comprehension 1
1 Videos
- GRAPHICAL INTERPRETATIONBOOK - GRB PUBLICATIONCHAPTER - GRAPHICAL INTERPRETATIONEXERCISE - Comprehension
49 Videos
- GRAPHICAL INTERPRETATIONBOOK - GRB PUBLICATIONCHAPTER - GRAPHICAL INTERPRETATIONEXERCISE - Electrochemistry
9 Videos
- F-BLOCK ELEMENTSBOOK - GRB PUBLICATIONCHAPTER - F-BLOCK ELEMENTSEXERCISE - Subjective type
7 Videos
- HYDROCARBON (ALIPHATIC)BOOK - GRB PUBLICATIONCHAPTER - HYDROCARBON (ALIPHATIC)EXERCISE - Previous years jee questions
28 Videos
Similar Questions
Knowledge Check
Consider the following statement regarding Maxwell's distribution of speeds. The correct statement(s) is/are :
Aas temperature increases, the peak (maxima ) of a curve is shifted towards right sideBas temperature increases, the most probable speed of molecules increases but fraction of molecules of maximum speed decreasesCthe area under the curve at all the temperatures is the same because it rpresents the number of gaseous moleculesDthe fractions of molecules having different speeds are different at a given temperatureWhich of the following radial probability distribution graph is correct for 5s orbital ?
A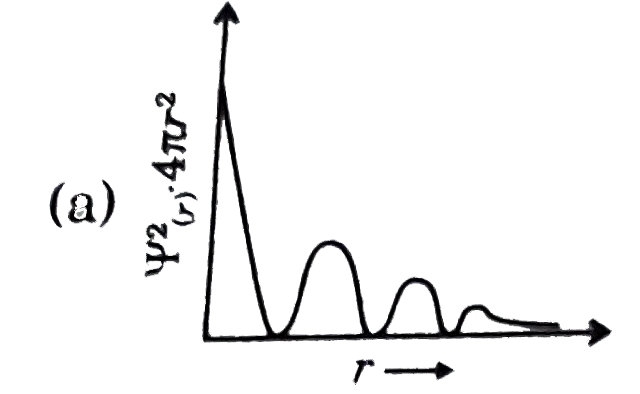 B
B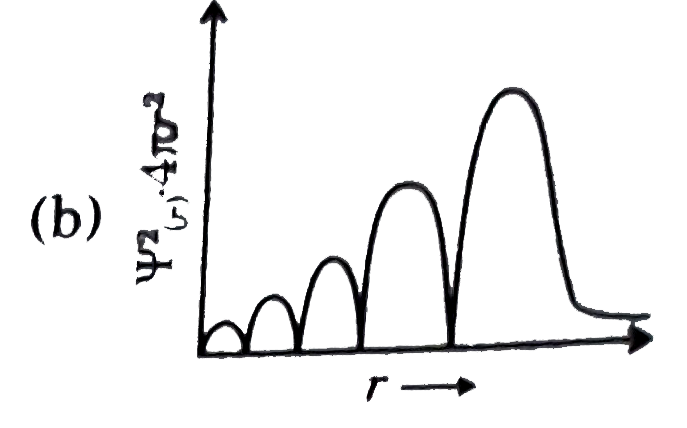 C
C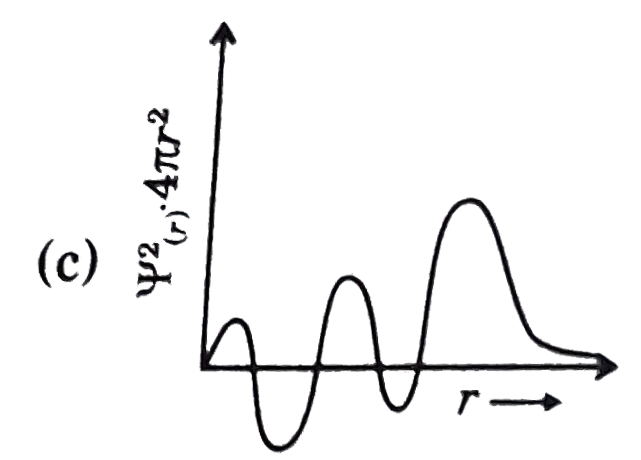 D
D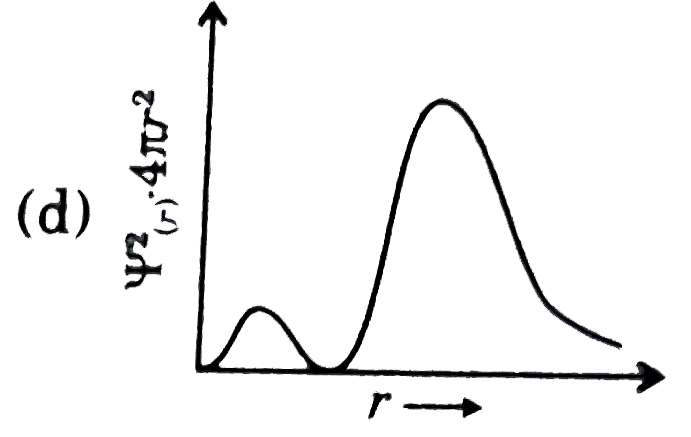
Which of the following options regarding area under the graph is/are correct ?
AThe area under the V us P graph will give magnitude of work involved in the processBThe area under T us S graph will give magnitude of heat exchange involved if the process occurs reversiblyCThe area under S us T graph will given magnitude of heat exchange involved in the process.DThe area under P us V graph will give magnitude of free energy change in an isothermal process
Which of the following plot is correct about Maxwell's speed distribution low ?
View SolutionThe gas molecules randomly move in an directions and collide with each other and with the wall of the container. It is dificult to detemine the speed of an individual molecule but it has become possible to Work out the distribution of molecules among different molecular speeds. This is known as Maxwell
Boltzmann distribution.
Consider the following graph about Maxwell's distribution of speeds at two different temperatures T1andT2 and answer the following questions:
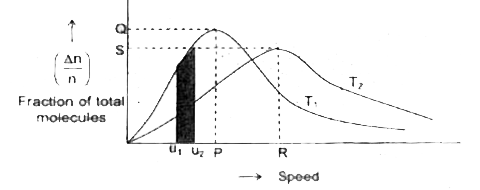
In the above graph the point P' refers to
View SolutionThe gas molecules randomly move in an directions and collide with each other and with the wall of the container. It is dificult to detemine the speed of an individual molecule but it has become possible to Work out the distribution of molecules among different molecular speeds. This is known as Maxwell
Boltzmann distribution.
Consider the following graph about Maxwell's distribution of speeds at two different temperatures T1andT2 and answer the following questions:
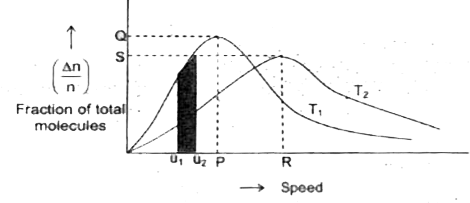
The shaded area represents
View SolutionThe gas molecules randomly move in an directions and collide with each other and with the wall of the container. It is dificult to detemine the speed of an individual molecule but it has become possible to Work out the distribution of molecules among different molecular speeds. This is known as Maxwell
Boltzmann distribution.
Consider the following graph about Maxwell's distribution of speeds at two different temperatures T1andT2 and answer the following questions:
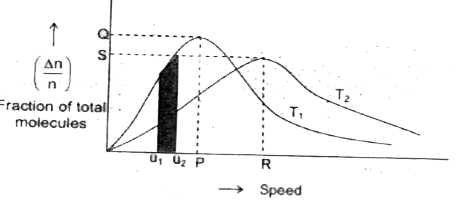
Total area under the curve at T1 is
View SolutionWhich of the following statements regarding noble gases is false ?
View Solution
