Read the graph and find the height of Tarun when he was of 5 years?
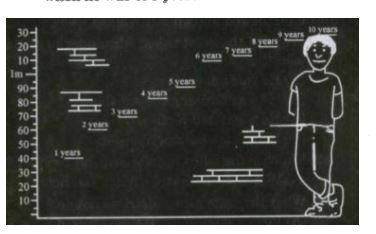
80 cm
85 cm
90 cm
95 cm
Step by step video & image solution for Read the graph and find the height of Tarun when he was of 5 years? by Maths experts to help you in doubts & scoring excellent marks in Class 6 exams.
Updated on:21/07/2023Similar Questions
Graph Reading
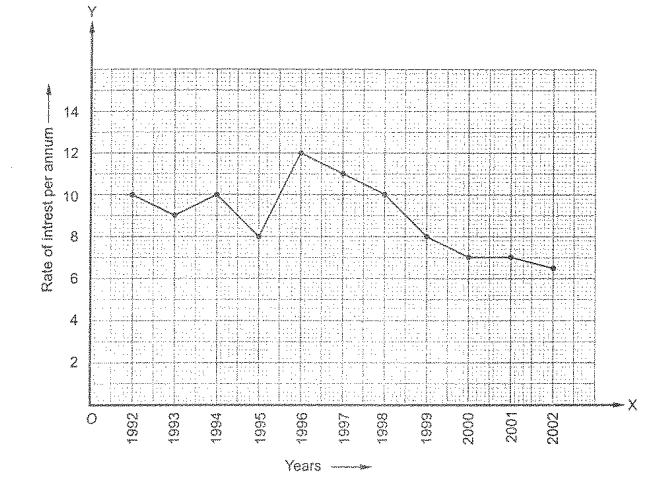
View SolutionThe graph shown in Figure exhibits the rate of interest on fixed deposits upto one year announced by the Reserve Bank of India in different years. Read the graph and find:
In which period was the rate of interest maximum?
In which period was the rate of interest minimum?
View Solution
Knowledge Check
Read the graph and answer the following questions.
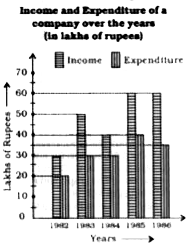
The number of years in which the income is more than the average income of the given years isAOneBTwoCThreeDFourThe following graph gives Sales, Expenses and Capital of a company for a period of five years 1994 to 1998. Read the graph and answer the following questions.
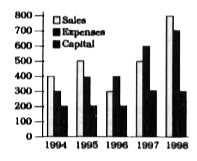
In which year was the Sales to Expense ratio the lowest?A1994B1996C1997D1998
The graph exhibits the rate of interest on fixe deposits upto one year announced by the Reserve Bank of India in different years. Read the graph and find :
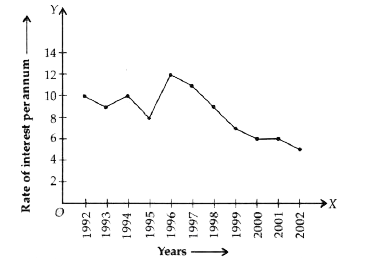
(i) In which period was the rate of interest maximum?
(ii) In which period was the rate of interest minimum?
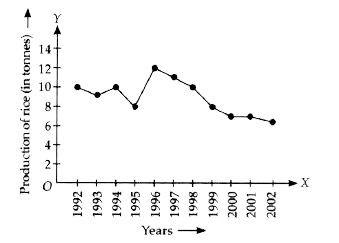
View SolutionThe graph shown in figure exhibits the production of rice for different years. Read the graph and find, in which period was the production remains constant?
View SolutionFor the information given in the above question, find the heights of the bars, when the data represented in a bar graph: Scale of the graph: 1 cm = Rs 500.
View SolutionFor the information given in the above question, find the heights of the bars, when the data represente in a bar graph : Scale of the graph : 1 cm = Rs. 500.
View SolutionIn the following questions are based on the following bar graph,Read the graphs and answer the questions.
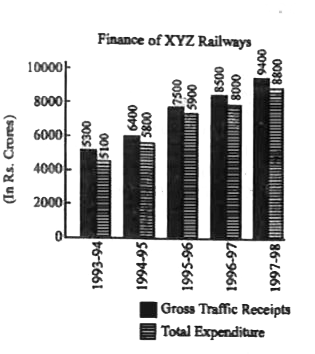
In which year was the profit as a percentage of gross traffic the highest?
View SolutionThe following questions are based on the bar graph. Read the graph and answer the questions.
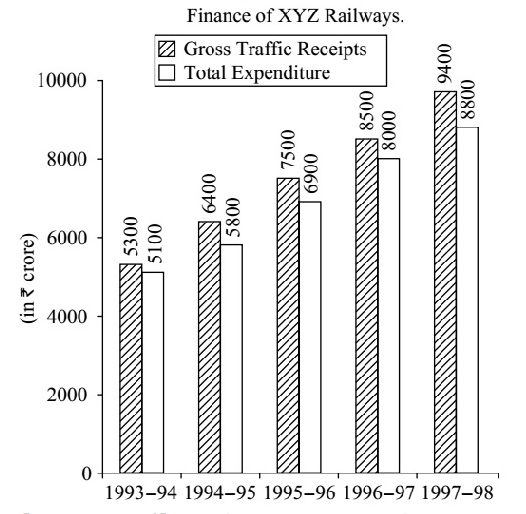
In which year was the profit as a percentage of gross traffic receipts highest?
View Solution
