From the bar chart, determine the number of students who cover a distance of 5 km or more to come to school.
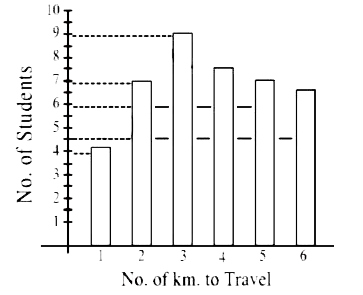
8
10
11
14
The correct Answer is:C
Step by step video & image solution for From the bar chart, determine the number of students who cover a distance of 5 km or more to come to school. by Maths experts to help you in doubts & scoring excellent marks in Class 6 exams.
Similar Questions
The table given below shows the number of students who were absent and percentage of students who were present in the given two examinations from five different schools. The table also shows the percentage of students who were present in the Biology and Physics examination respectively.

If the number of students who were present in the Physics examination from school A is 250% of the difference of the number of the students who were present in Physics and bilogy examination, from school K, then what is the ratio of the number of students who were present from school L to number of students who were present in Physics examination from school A?View SolutionThe table given below shows the number of students who were absent and percentage of students who were present in the given two examinations from five different schools. The table shows the percentage of students who were present in the Biology and Physics examination respectively.
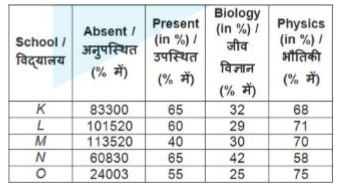
If the number of students who were present in the Physics examination from school A is 250% of the difference of the number of the students who were present in Physics and Biology examination, from school K, then what is the ratio of the number of students who were present from school L to number of students who were present in Physics examination from school A?View Solution
Knowledge Check
- Question 1 - Select One
The pie-chart given below represents the number of students using different transport to a school in which total number of students is 2160.
Answer the questions based on the following diagram.
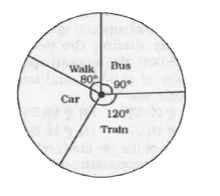
The ratio of the number of students who come to school by car to the number of students who come to school by bus isA21:24B21:27C36:27D36:21 - Question 2 - Select One
The following bar chart represents the number of first year B. Com. Students of St Xavier's College using different companies smart phones. Study bar chart and answer the questions.
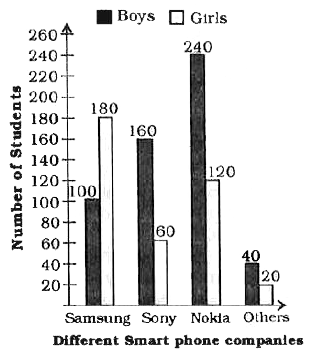
The bar chart representing the number of students using different smart phones.
What percentage of boys are using the smart phones of Samsung ?A16.52%B17.52%C18.52%D15.52% - Question 3 - Select One
The following bar chart represents the number of first year B. Com. Students of St Xavier's College using different companies smart phones. Study bar chart and answer the questions.
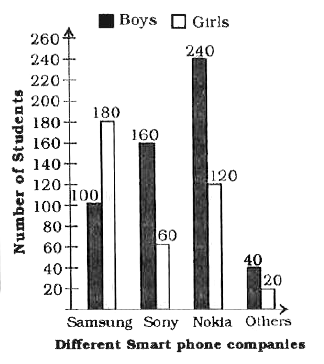
The bar chart representing the number of students using different smart phones.
What percentage of girls are using the smart phones of Nokia ?A33.58%B32.58%C30.58%D31.58%
Following pie chart shows the degree wise distribution of the students of a school using different transport while going to school. Read the chart answer the questions carefully.
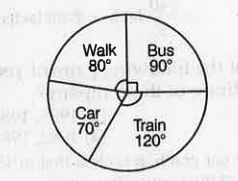
Total number of students = 2160
The number of students who come to school by car, isView SolutionThe following piechart shows the number of students who failed in different subjects in an examination. Examine the chart and answer the questions 5 to the total number of students who have failed is 500.

Number of students who failed in Mathema tics is less than the students who did not qualify in language is -View SolutionFollowing pie chart shows the degree wise distribution of the students of a school using different transport while going to school. Read the chart answer the questions carefully.
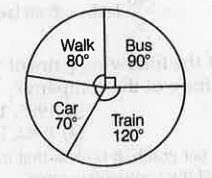
Total number of students = 2160
Find the ratio of number of students who come to school by bus and that of by car.View SolutionThe pie-chart given below represents the number of students using different transport to a school in which total number of students is 2160.
Answer the questions based on the following diagram.
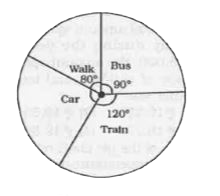
The number of students coming to school by bus exceeds the number of students coming to school walking byView SolutionRead the following table carefully and answer the questions given below.

If the number of appeared students from school A in 2000 and number of appeared students from school C in 1999 are equal, what is the respective ratio between the number of passed students from school A in 2000 and number of passed students from school C in 1999 ?View Solution

