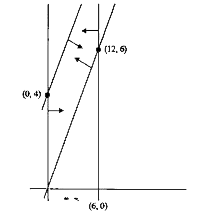
The feasible region for an LPP is shown in the figure . Let F = 3 x - 4 y be the objective function. Minimum value of F is:
 Solution in Punjabi
0
−16
12
does not exist
The correct Answer is:D
Step by step video, text & image solution for The feasible region for an LPP is shown in the figure . Let F = 3 x - 4 y be the objective function. Minimum value of F is: by Maths experts to help you in doubts & scoring excellent marks in Class 12 exams.
Updated on:21/07/2023Topper's Solved these Questions
- LINEAR PROGRAMMING BOOK - ACCURATE PUBLICATIONCHAPTER - LINEAR PROGRAMMING EXERCISE - QUESTIONS CARRYING 1 MARK (TYPE-II : FILL IN THE BLANKS QUESTIONS)
11 Videos
- LINEAR PROGRAMMING BOOK - ACCURATE PUBLICATIONCHAPTER - LINEAR PROGRAMMING EXERCISE - QUESTIONS CARRYING 1 MARK (TYPE-III : TRUE OR FALSE QUESTIONS)
10 Videos
- LINEAR PROGRAMMING BOOK - ACCURATE PUBLICATIONCHAPTER - LINEAR PROGRAMMING EXERCISE - QUESTIONS CARRYING 6 MARKS
7 Videos
- INVERSE TRIGONOMETRIC FUNCTIONSBOOK - ACCURATE PUBLICATIONCHAPTER - INVERSE TRIGONOMETRIC FUNCTIONSEXERCISE - QUESTIONS CARRYING 4 MARKS
27 Videos
- MATRICESBOOK - ACCURATE PUBLICATIONCHAPTER - MATRICESEXERCISE - QUESTIONS CARRYING 6 MARKS
4 Videos
Similar Questions
In a LPP, the linear inequalities or restrictions on the variables are called ..............
View SolutionIf the feasible region for a linear programming problem is bounded, then the objective function Z = ax+by has both a maximum and a minimum value on R.
View SolutionFind the maximum value of f = x+2 y subject to the constraints
2x+3y≤6
x+4y≤4
x,y≥0
View SolutionWrite the value of tan−1[2sin(2cos−1√32)].
View SolutionIf A=⎡⎢⎣1−202130−21⎤⎥⎦,B=⎡⎢⎣72−6−21−3−425⎤⎥⎦ , find AB Also solve x−2y=10,2x+y+3z=8,−2y+z=7
View SolutionHow many lines of symmetry does the above figure have ?
View SolutionA light ray from an object 'P' is reflected from a mirror as shown in the figure, then
ltimg src="https://d10lpgp6xz60nq.cloudfront.net/physics_images/PS_PHY_VII_C04_E07_004_Q01.png" width="80%"gt
View SolutionDetermine the point of symmetry of a regular hexagon.
View SolutionDtermine the images of the following figure about the given line :
View SolutionMatch the following Column A to Column B

View SolutionMatch the following Column A to Column B

View SolutionMatch the following Column A to Column B

View SolutionThe inequation represented by the graph given below is :
View SolutionThe inequation that best describes the graph given below is _________
View SolutionThe inequation that best describes the following graph is _________
View SolutionWhich inequations represent the shaded region in the given figure
View Solution
