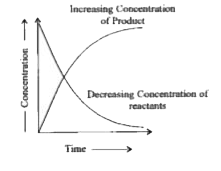
Draw the diagram for reactant change its concentration with time? Solution in Punjabi
Topper's Solved these Questions
- BOOK - ACCURATE PUBLICATIONCHAPTER - CHEMICAL KINETICSEXERCISE - 2 MARK QUESTIONS9videos
CHEMICAL KINETICS
- BOOK - ACCURATE PUBLICATIONCHAPTER - CHEMICAL KINETICSEXERCISE - NUMERICAL OF HALF LIFE TIME PERIOD6videos
CHEMICAL KINETICS
- BOOK - ACCURATE PUBLICATIONCHAPTER - CHEMICAL KINETICSEXERCISE - TOPIC : CHEMICAL KINETIC69videos
CHEMICAL KINETICS
- BOOK - ACCURATE PUBLICATIONCHAPTER - BOARD PAPER MARCH - 2020EXERCISE - SECTION - D18videos
BOARD PAPER MARCH - 2020
- BOOK - ACCURATE PUBLICATIONCHAPTER - COORDINATION COMPOUNDS EXERCISE - 2 MARKS QUESTIONS23videos
COORDINATION COMPOUNDS
Similar Questions
What is the difference between instantaneous rate of a reaction and rate constant?
01:14View SolutionA first order reaction is 20% complete in the 10 minutes. Calculate the time period for 75% completion of the reaction.
02:01View SolutionA first order reaction is 20% complete in the 10 minutes. Calculate the time period for 75% completion of the reaction.
02:22View SolutionICI7 does not exist while IF7 exist. Why ?
01:35View SolutionWhat is the difference between a complex salt and a double salt?
View SolutionDraw a schematic graph showing how the rate of first order reaction changes with change in concentration of reactants.
02:01View SolutionConsider the reaction A→B. The concentration of both the reactants and the products varies exponentially with time. Which of the following figure correctly describes the change in concentration of reactants and products with time ?
01:14View SolutionThe increase in concentration of the reactants lead changes in
02:05View Solutionसमय के किसी विशेष क्षण पर किसी अभिकारक के सान्द्रण में परिवर्तन की दर उस समय दर………….कहलाती है।
08:29View SolutionIncrease in the concentration of the reactants leads to the changes in
02:41View SolutionConsider the reaction A→B. The concentration of both the reactants and the products varies exponentially with time. Which of the following figure correctly describes the change in concentration of reactants and products with time ?
05:16View SolutionDraw a schematic graph showing how the rate of a first order reaction changes with change in concentration of the reactant.
02:54View SolutionAt the equilibrium of a reversible reaction , the concentration of the reactants and the products will be equal .
03:35View SolutionPlot a graph of concentration of a reactant at time t, [ (a-x)] against time for a first order reaction .Here a = initial concentration of the reactant an x = change in concentration of the reactant at any time 1 during the reaction.
01:41View Solutionशून्य कोटि अभिक्रिया के लिये, अभिकारक की सांद्रता व समय का आरेख होता है (सांद्रता y-अक्ष को प्रदर्शित करती है)
01:26View SolutionConsider the reaction A→B. The concentration of both the reactants and the products varies exponentially with time. Which of the following figure correctly describes the change in concentration of reactants and products with time ?
02:22View Solution


