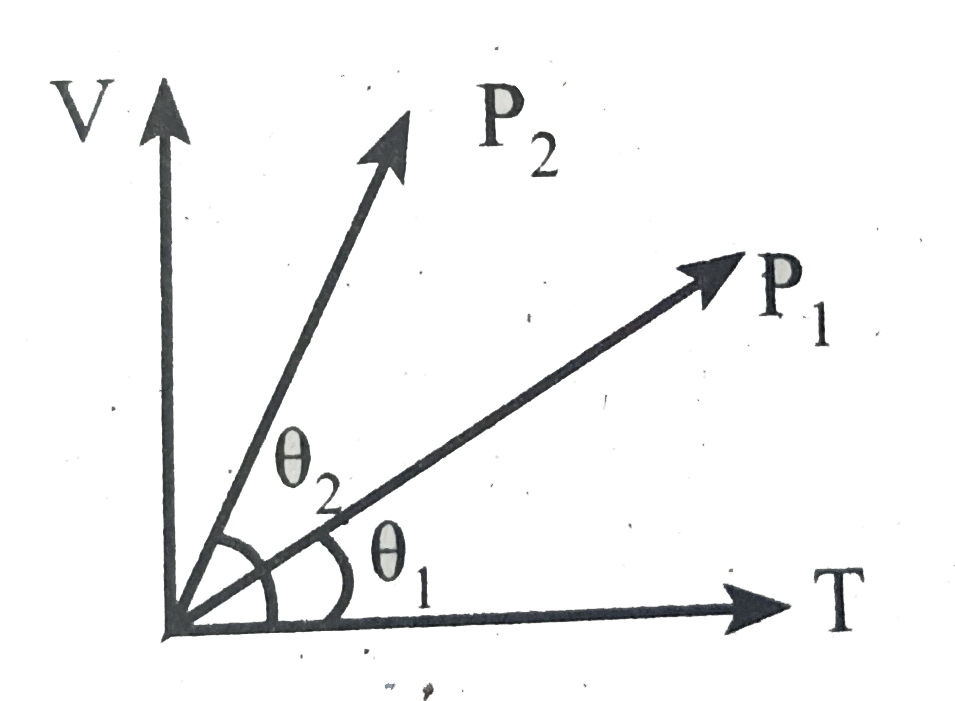
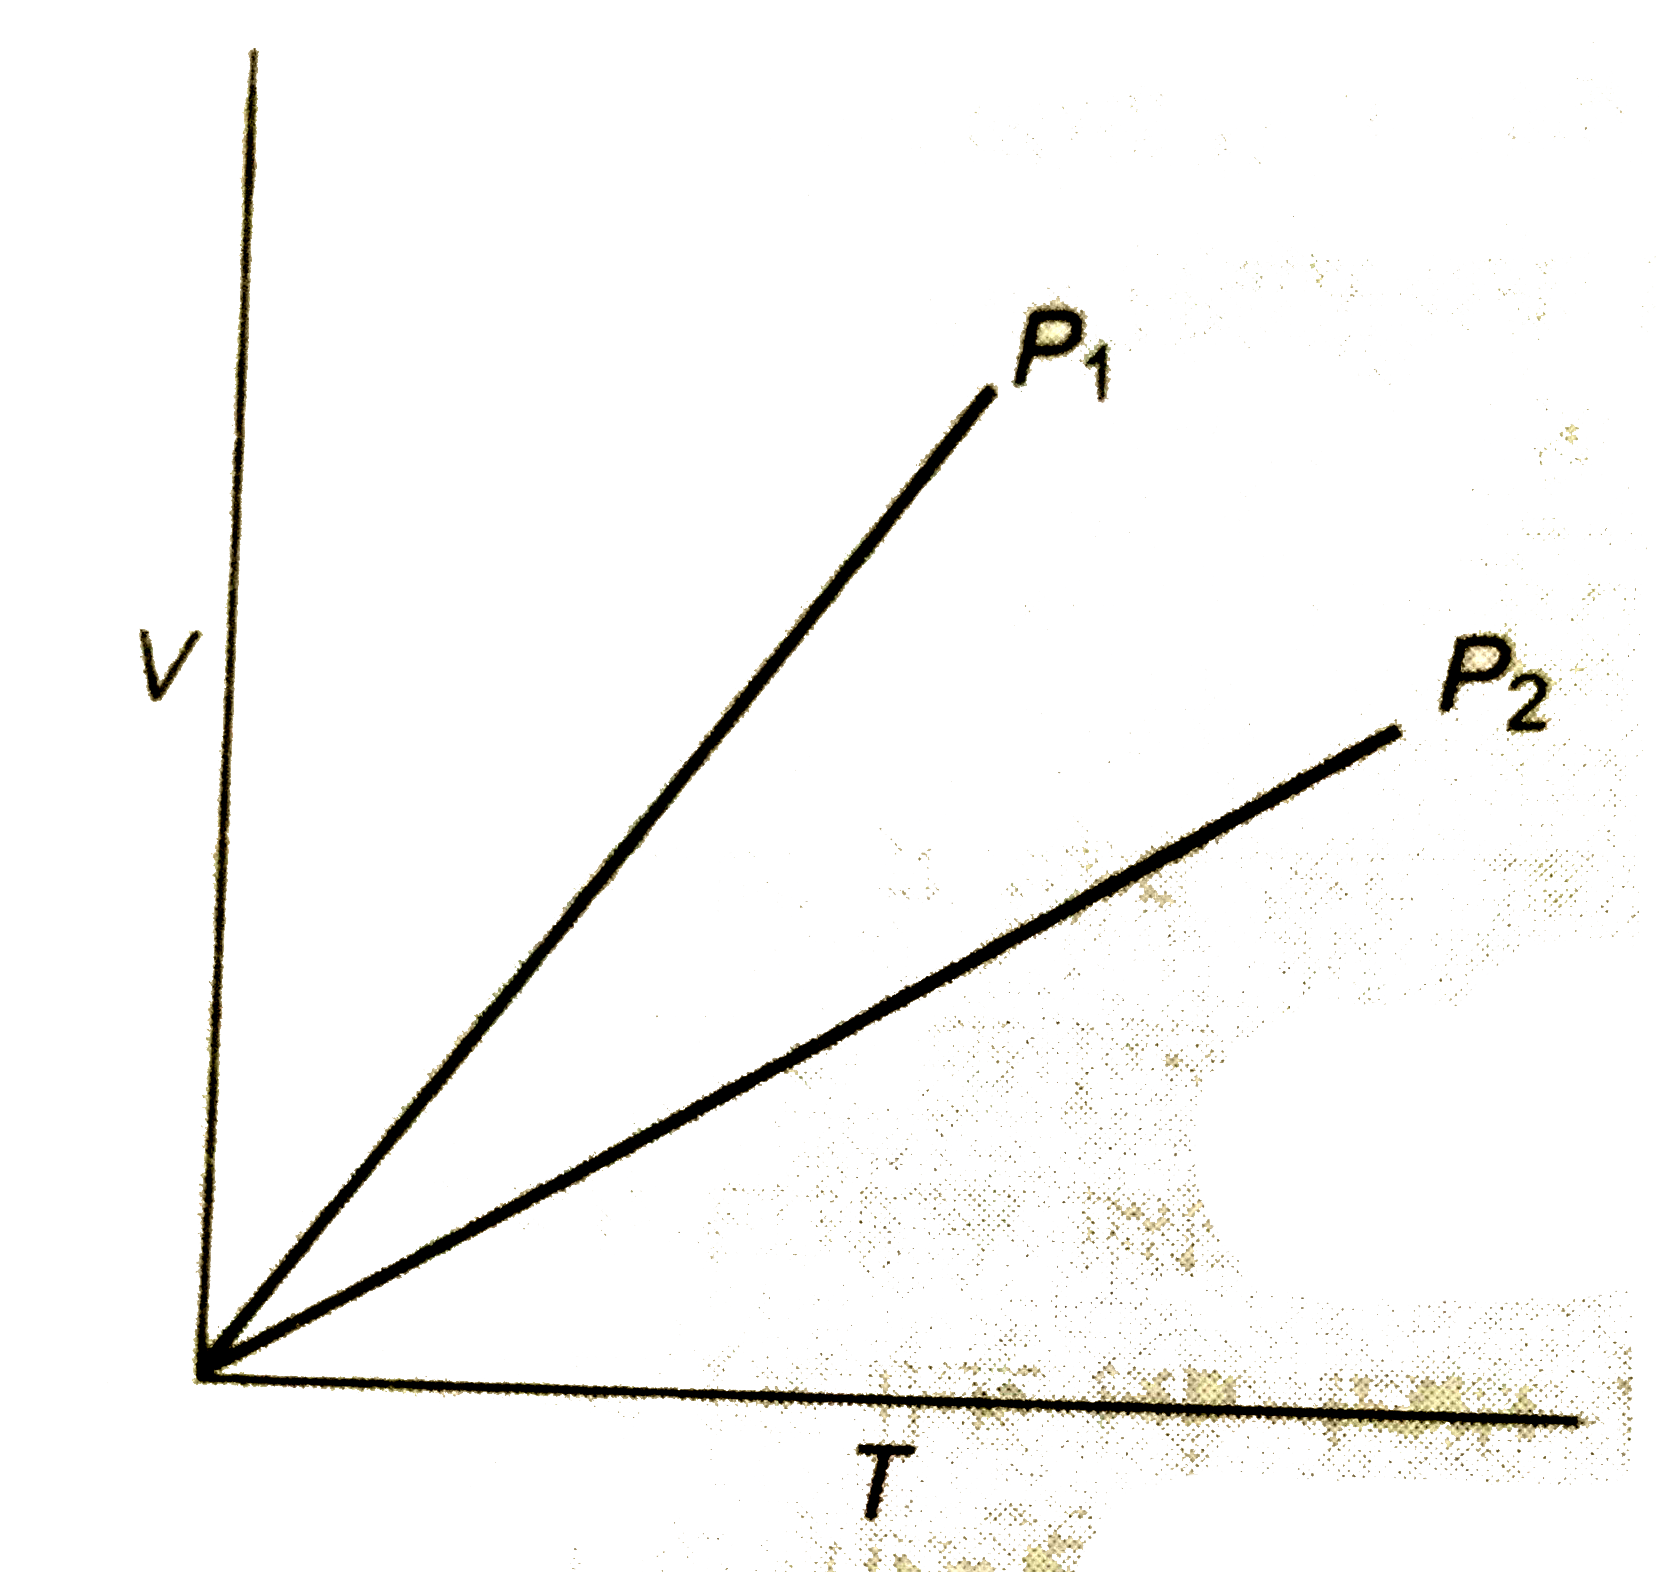
In the given (V-T) diagram , what is the relation between P1andP2 ?
 Solution in Tamil
P2=P1
P2>P1
P2<P1
Cannot be predicted
Step by step video & image solution for In the given (V-T) diagram , what is the relation between P_(1) "and" P_(2) ? by Physics experts to help you in doubts & scoring excellent marks in Class 11 exams.
Updated on:21/07/2023Topper's Solved these Questions
Similar Questions
A black body is at 727∘C It emits energy at a rate which is proportional to :
View SolutionIn the given (V-T) diagram, what is the relation between pressure P_(1) and P_(2) ?
View SolutionThe given diagram shows point P1,P2P3&P4 in 1s orbital.
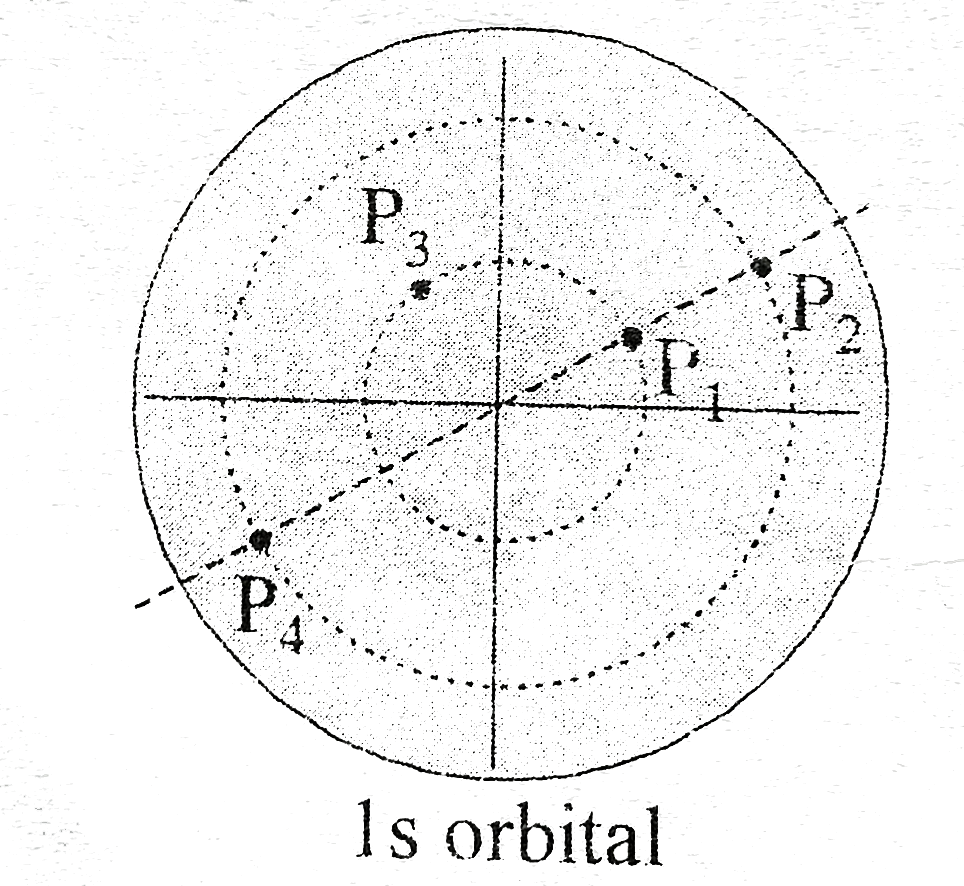
The correct oreder of increasing radial probability at these point are
View Solution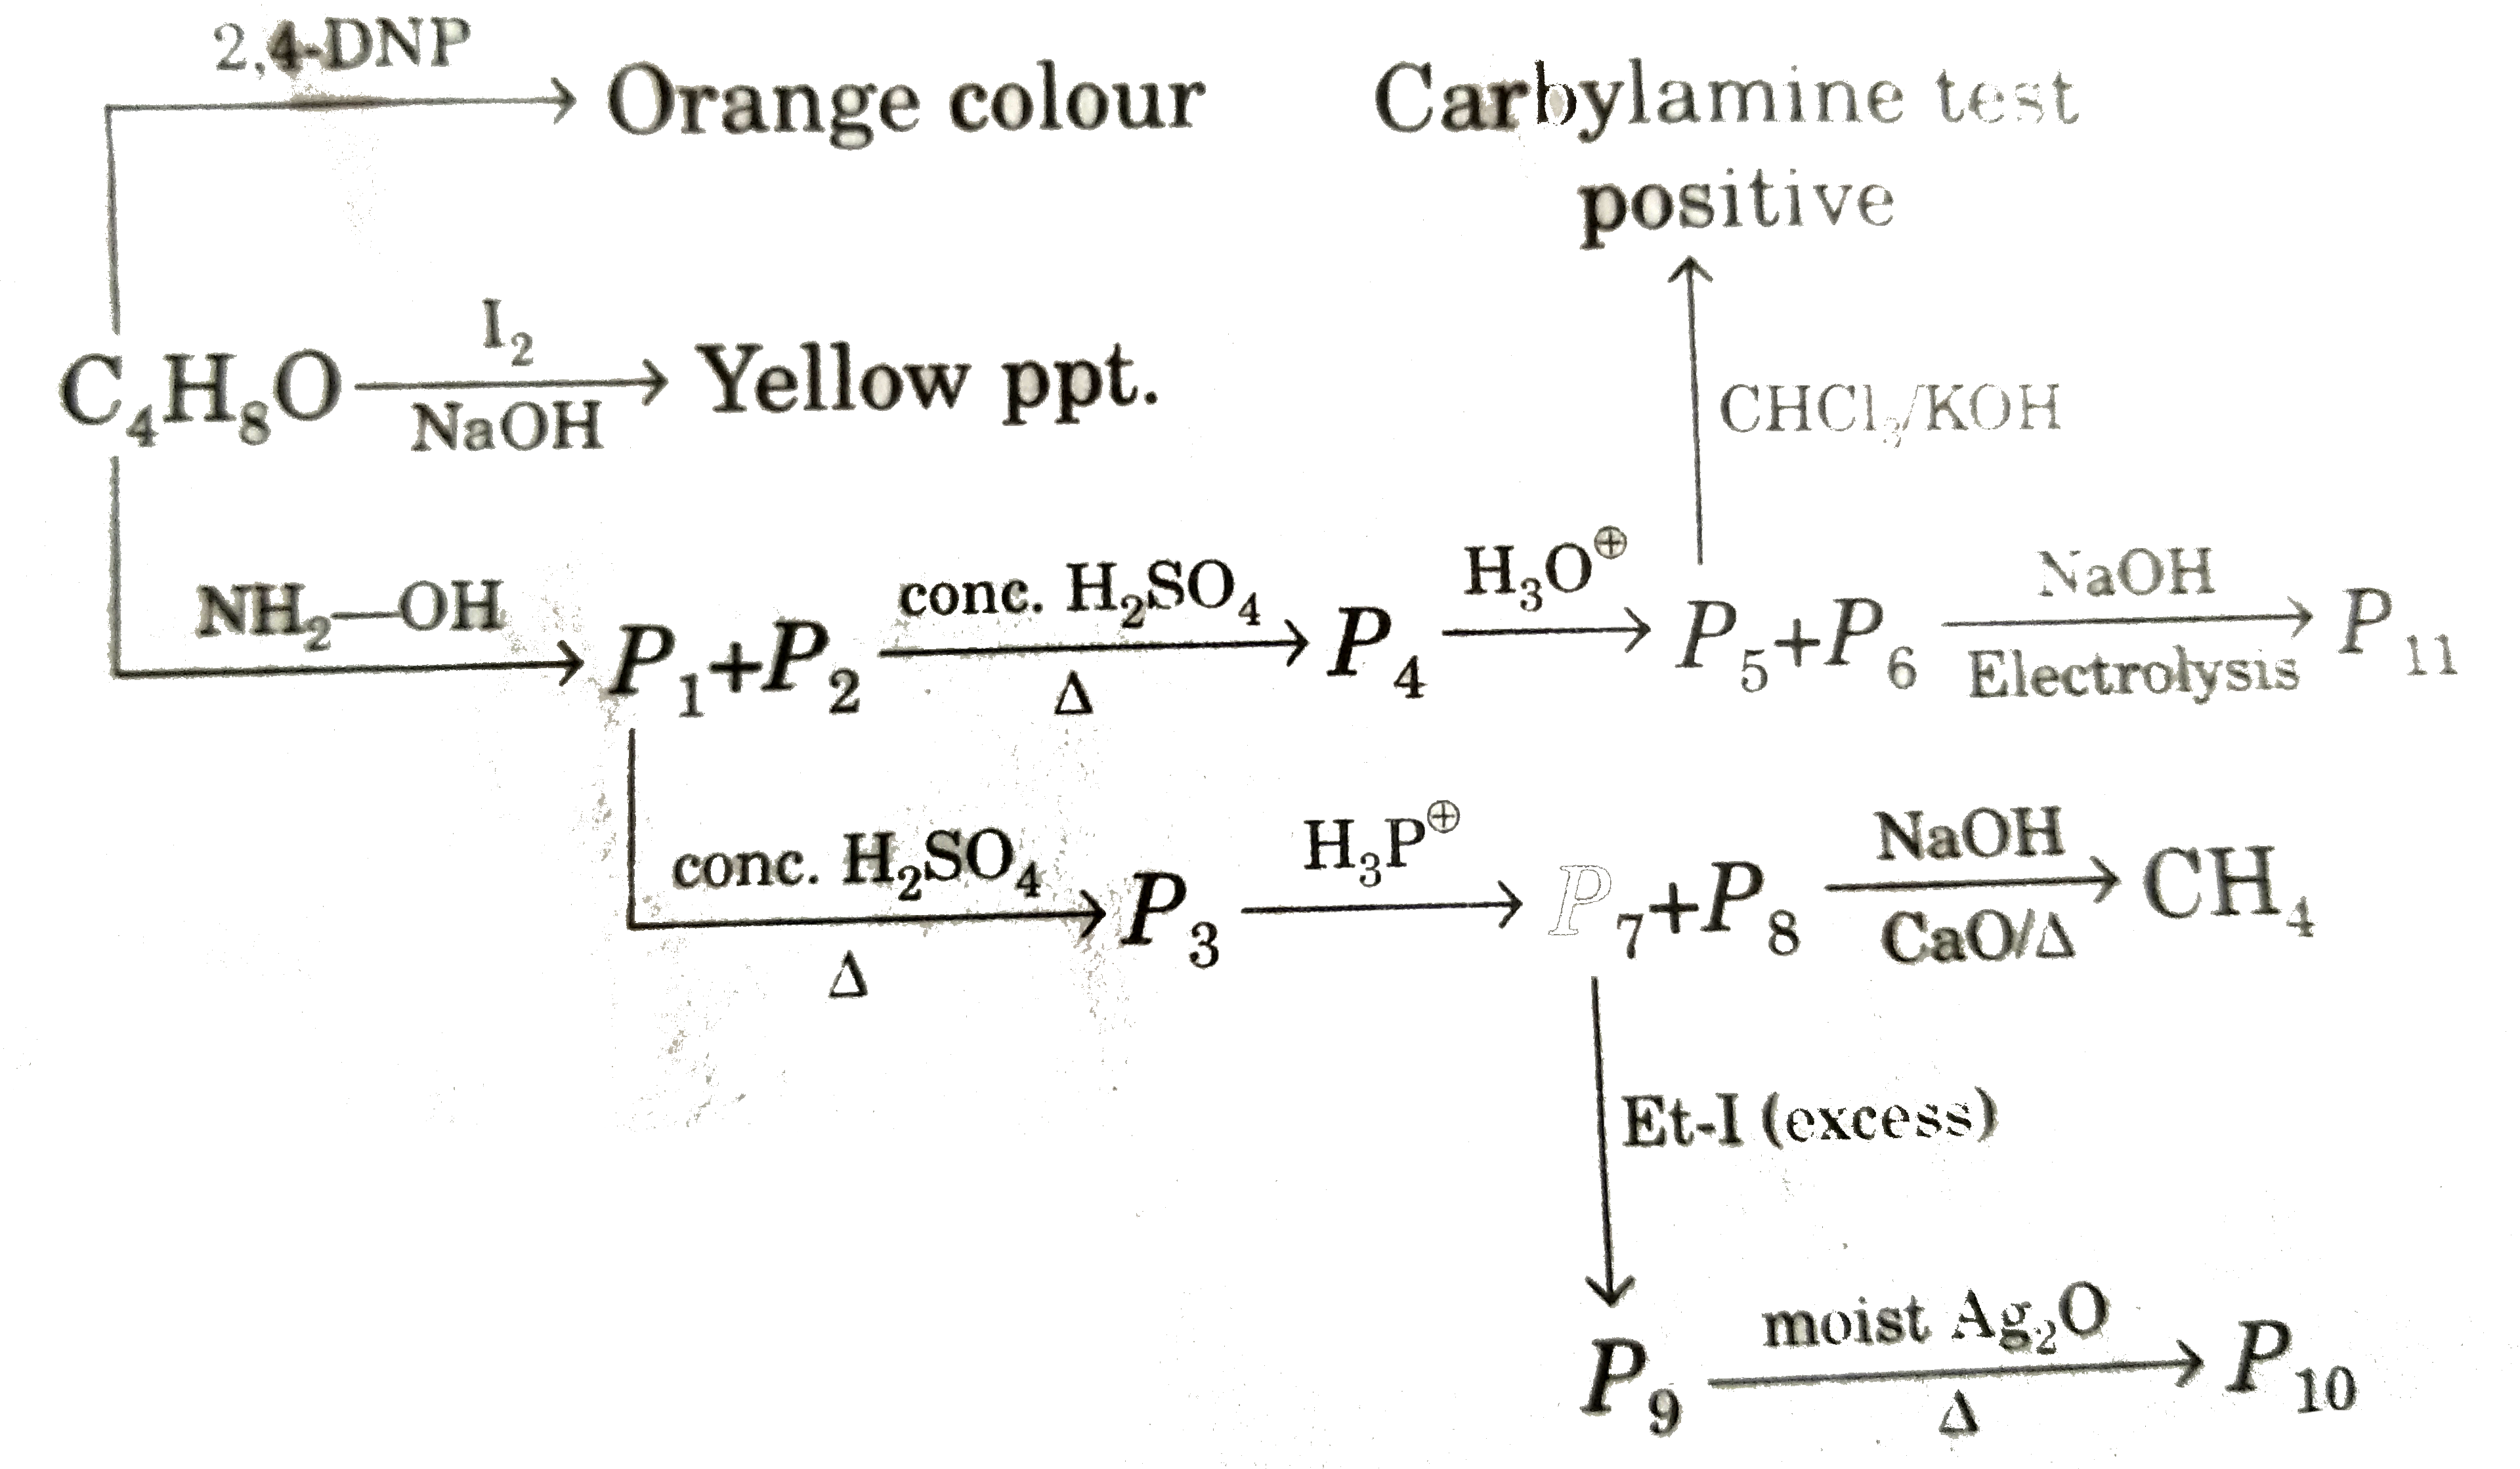
What is the relationship between P1 and P2
View SolutionV vs T curves at constant pressure P1 and P2 for an ideal gas are shown below
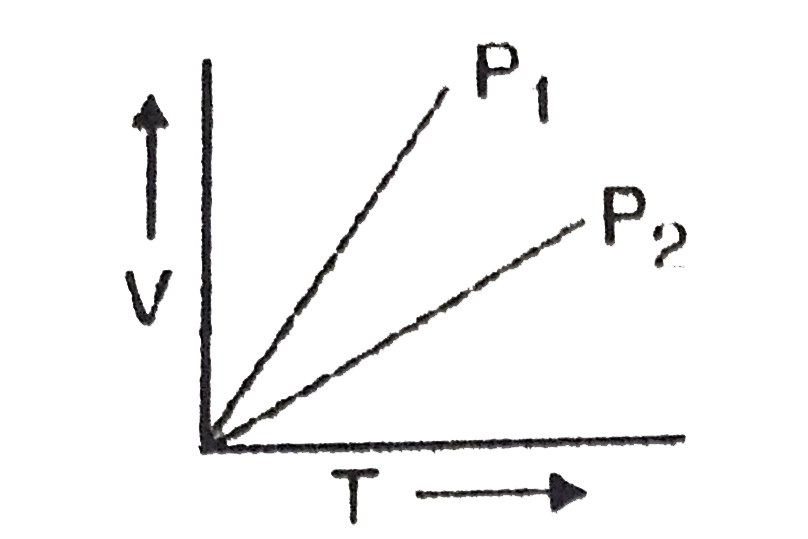
Which is correct ?
View SolutionThe sequence p1,p2,p3,... satisfies the relation 2pn=pn−1+pn+1 where n>1. Given that p5=26 and p7=38, then find the value of p50+p90.
View SolutionShow that the relation R defined in the set A of all polygons as R={(P1,P2):P1andP2 have same number of sides}, is an equivalence relation. What is the set of all elements in A related to the right angle triangle T with sides 3,4 and 5 ?
View Solutionदिए गए (V-T) ग्राफP1 में P2और के मध्य सम्बन्ध होगा -
View SolutionIn the given (V-T) diagram , what is the relation between P1andP2 ?

View SolutionIn the given (V-T) diagram , what is the relation between P1andP2 ?

View Solutionदर्शाये गये (V-T) आरेख में दाब P1 तथा P2 के बीच क्या संबंध है
View SolutionWhich of the following relation is true between partial pressure, volume and temperature? (i) P = (nRT)/(V) (ii) P_("total") = p_(1) + p_(2) + p_(3) (iii) P_("total") = (n_(1) + n_(2) + n_(3)) (RT)/(V)
View SolutionIn the given (V-T) diagram, what is the relation between pressures P_(1) and P_(2) ?
View SolutionIn the given (V-T) diagram, what is the relation between pressure P_(1) and P_(2) ?
View SolutionIn the given (V-T) diagram, what is the relation between pressure P1andP2 ?
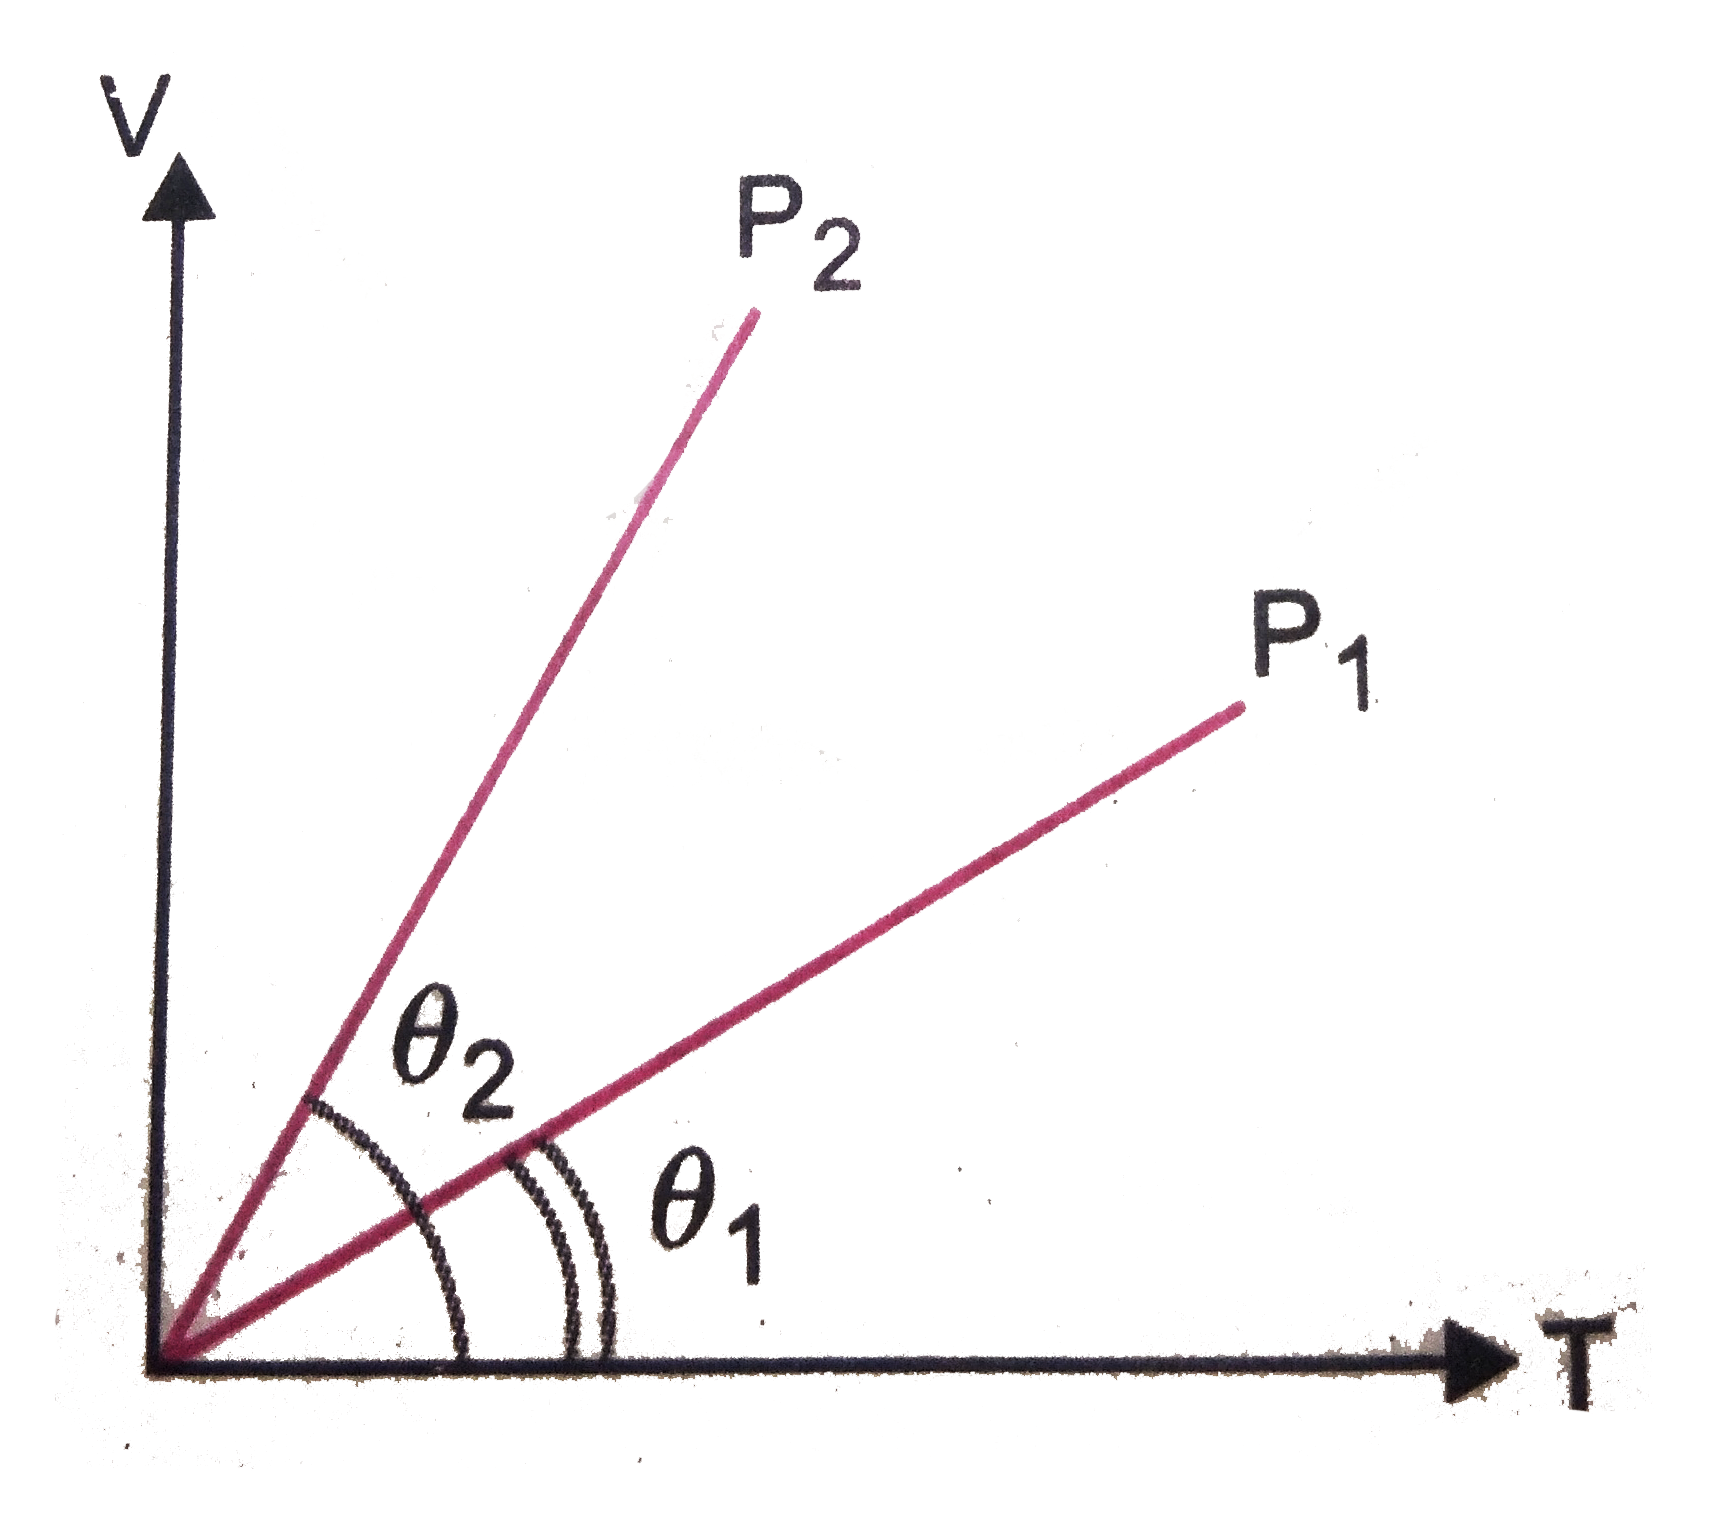
View SolutionFor V versus T curves at constant pressure P_(1) and P_(2) for an ideal gas are shown in the figure given below
View Solution
