Read the following graph and answer questions
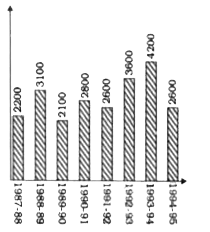
In which of the following years, the percent increase of deficit was highest over its preceding year?
1992-93
1990-91
1993-34
1988-89
The correct Answer is:D
Step by step video & image solution for Read the following graph and answer questions In which of the following years, the percent increase of deficit was highest over its preceding year? by Maths experts to help you in doubts & scoring excellent marks in Class 14 exams.
Updated on:21/07/2023Topper's Solved these Questions
- STATISTICS AND DATA INTERPRETATIONBOOK - KIRAN PUBLICATIONCHAPTER - STATISTICS AND DATA INTERPRETATIONEXERCISE - TYPE-III
39 Videos
- STATISTICS AND DATA INTERPRETATIONBOOK - KIRAN PUBLICATIONCHAPTER - STATISTICS AND DATA INTERPRETATIONEXERCISE - TYPE-IV
182 Videos
- STATISTICS AND DATA INTERPRETATIONBOOK - KIRAN PUBLICATIONCHAPTER - STATISTICS AND DATA INTERPRETATIONEXERCISE - TYPE-VIII
8 Videos
- SIMPLIFICATIONBOOK - KIRAN PUBLICATIONCHAPTER - SIMPLIFICATIONEXERCISE - TEST YOURSELF
25 Videos
- TIME AND DISTANCEBOOK - KIRAN PUBLICATIONCHAPTER - TIME AND DISTANCEEXERCISE - Type -XI
74 Videos
Similar Questions
Read the following graph and answer questions
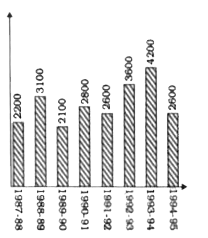
The ratio of the number of years, in which the trade deficit is above the average deficit, to those years in which the trade deficit is below the average deficit, is
View SolutionRead the following graph carefully and answer the questions given below:
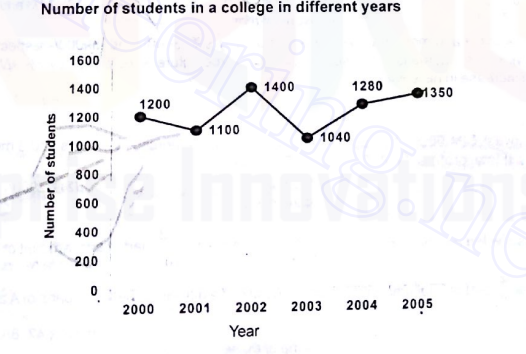
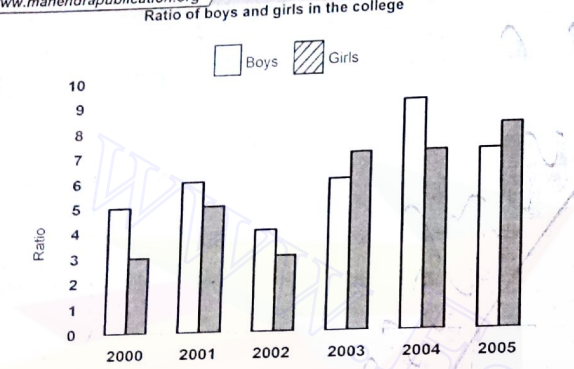
In which two years the number of girls is equal ?
View Solution
Knowledge Check
The following bar diagram analys the sale of a company from 2000 to 2005, Examine the diagram and answer the questions.
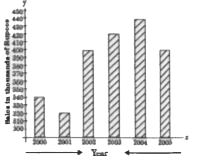
In which year did the sales show the least percent increase to that of the preceding year ?A2000B2002C2003D2004Read the following table and answer the questions below it:
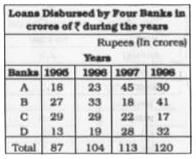
In which of the following banks, there was a continued increase in loan disbursement throughtout the years ?AABBCCDDStudy the following graph carefully and answer the questions that follow
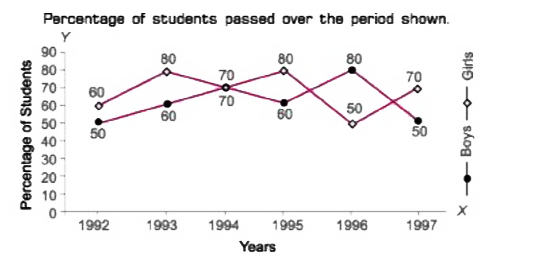
In which of the following years was the improvement of girls maximum as compared to that of previous years ?A1992B1993C1997D1995
Study the following graph carefully and answer the questions given below –
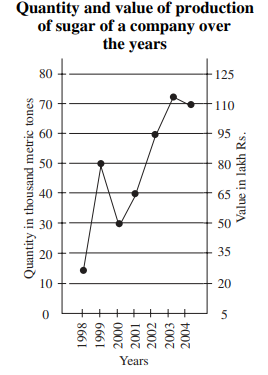
In which of the following years was the value of sugar per metric ton the lowest among the given years?
View SolutionStudy the following graph carefully and answer the questions that
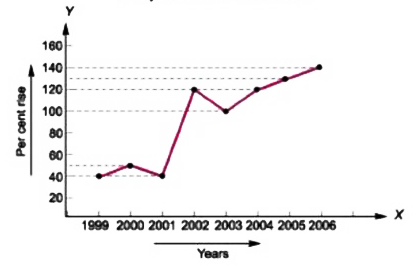
For which of the given years , the percent rise ( from the previous year ) was the least ? [ Years 2001 and 2003 are not to be considered ]
View SolutionThe year, in which the percentage increase in export was maximum from its preceding year, is
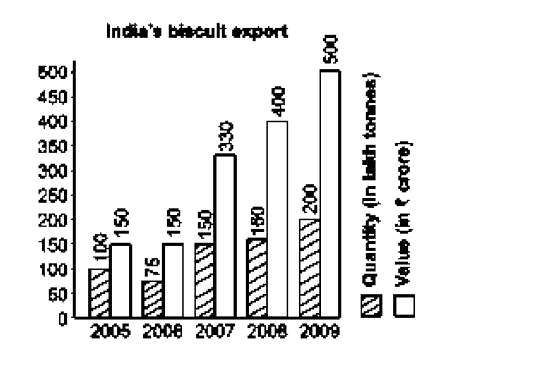
View SolutionStudy the graph carefully and answer the questions below it -----
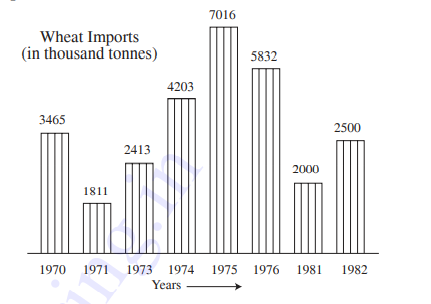
In which year did the imports register highest increase over its preceding year ?
View SolutionStudy the following graph carefully and answer the questions that
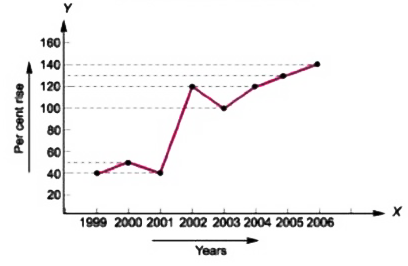
For how many years , the percent rise was lower than the average of the percent rise over the given years ?
View Solution
