The bar graph given below represents the number of players of a college taking part in three games for 3 years.
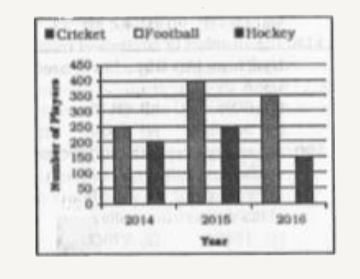
Total number of players in 2015 is what percent of total number of players in 2016?
950
900
1000
1050
The correct Answer is:C
Step by step video & image solution for The bar graph given below represents the number of players of a college taking part in three games for 3 years. Total number of players in 2015 is what percent of total number of players in 2016? by Maths experts to help you in doubts & scoring excellent marks in Class 14 exams.
Topper's Solved these Questions
- BOOK - KIRAN PUBLICATIONCHAPTER - STATISTICS AND DATA INTERPRETATIONEXERCISE - TYPE-III39videos
STATISTICS AND DATA INTERPRETATION
- BOOK - KIRAN PUBLICATIONCHAPTER - STATISTICS AND DATA INTERPRETATIONEXERCISE - TYPE-IV182videos
STATISTICS AND DATA INTERPRETATION
- BOOK - KIRAN PUBLICATIONCHAPTER - STATISTICS AND DATA INTERPRETATIONEXERCISE - TYPE-VIII8videos
STATISTICS AND DATA INTERPRETATION
- BOOK - KIRAN PUBLICATIONCHAPTER - SIMPLIFICATIONEXERCISE - TEST YOURSELF25videos
SIMPLIFICATION
- BOOK - KIRAN PUBLICATIONCHAPTER - TIME AND DISTANCEEXERCISE - Type -XI74videos
TIME AND DISTANCE
Similar Questions
The bar graph given below represents the number of players of a college taking part in three games for 3 years.
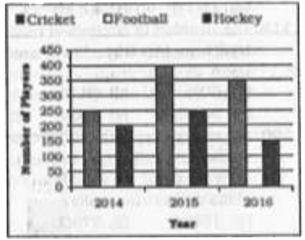
The number of players playing hockey in 2015 is what per cent of total number of players playing all the three games in 2015?View SolutionThe bar graph given below represents the number of players of a college taking part in three games for 3 years.

The number of players playing football in 2016 is how much per cent less than the players playing football in 2014?View Solution
Knowledge Check
- Question 1 - Select One
The bar graph given below represents the number of boys in a school using three apps for three months.
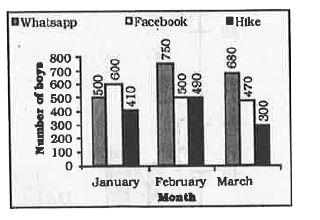
What is the total number of boys using the three apps in the month of March?A1420B1480C1450D1500 - Question 2 - Select One
The bar chart given below shows the number of cars sold by brand A and B for the year for 2008 to 2016
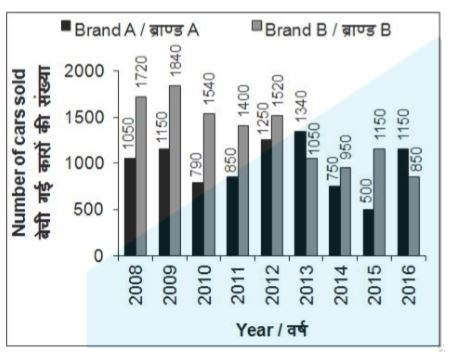
The total sales of the two brands in year 2015 is what percent of the total sales in 2016?A82.5B86.5C87.5D79.5 - Question 3 - Select One
The bar chart given below shows the number of staff in colleges A and B from years 2011 to 2016.
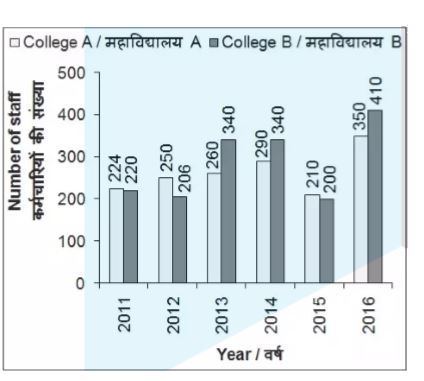
The number of staff in college A in year 2015 is how much percent more than the number of staff in college B in year 2015?A5B8C10D15
The bar graph given below represents the number of boys in a school using three apps for three months.
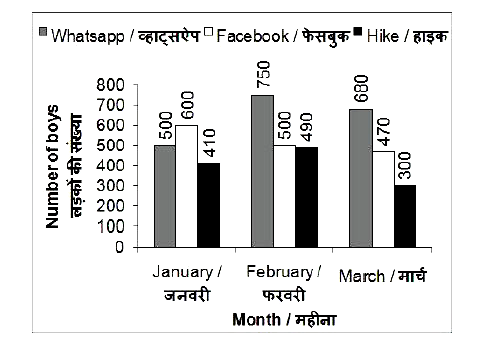
What is the total number of boys using the three apps in month of January?View SolutionThe bar graph given below represents the number of boys in a school using three apps for three months.
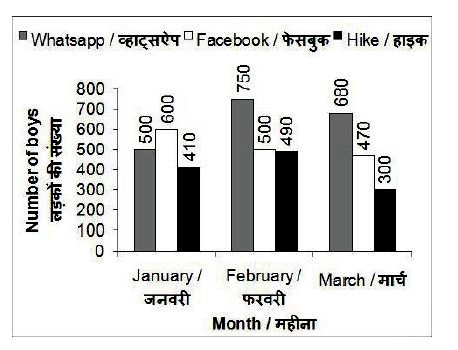
Number of boys using Whatsapp in February is how much percent more than the number of boys using Hike in February?View Solution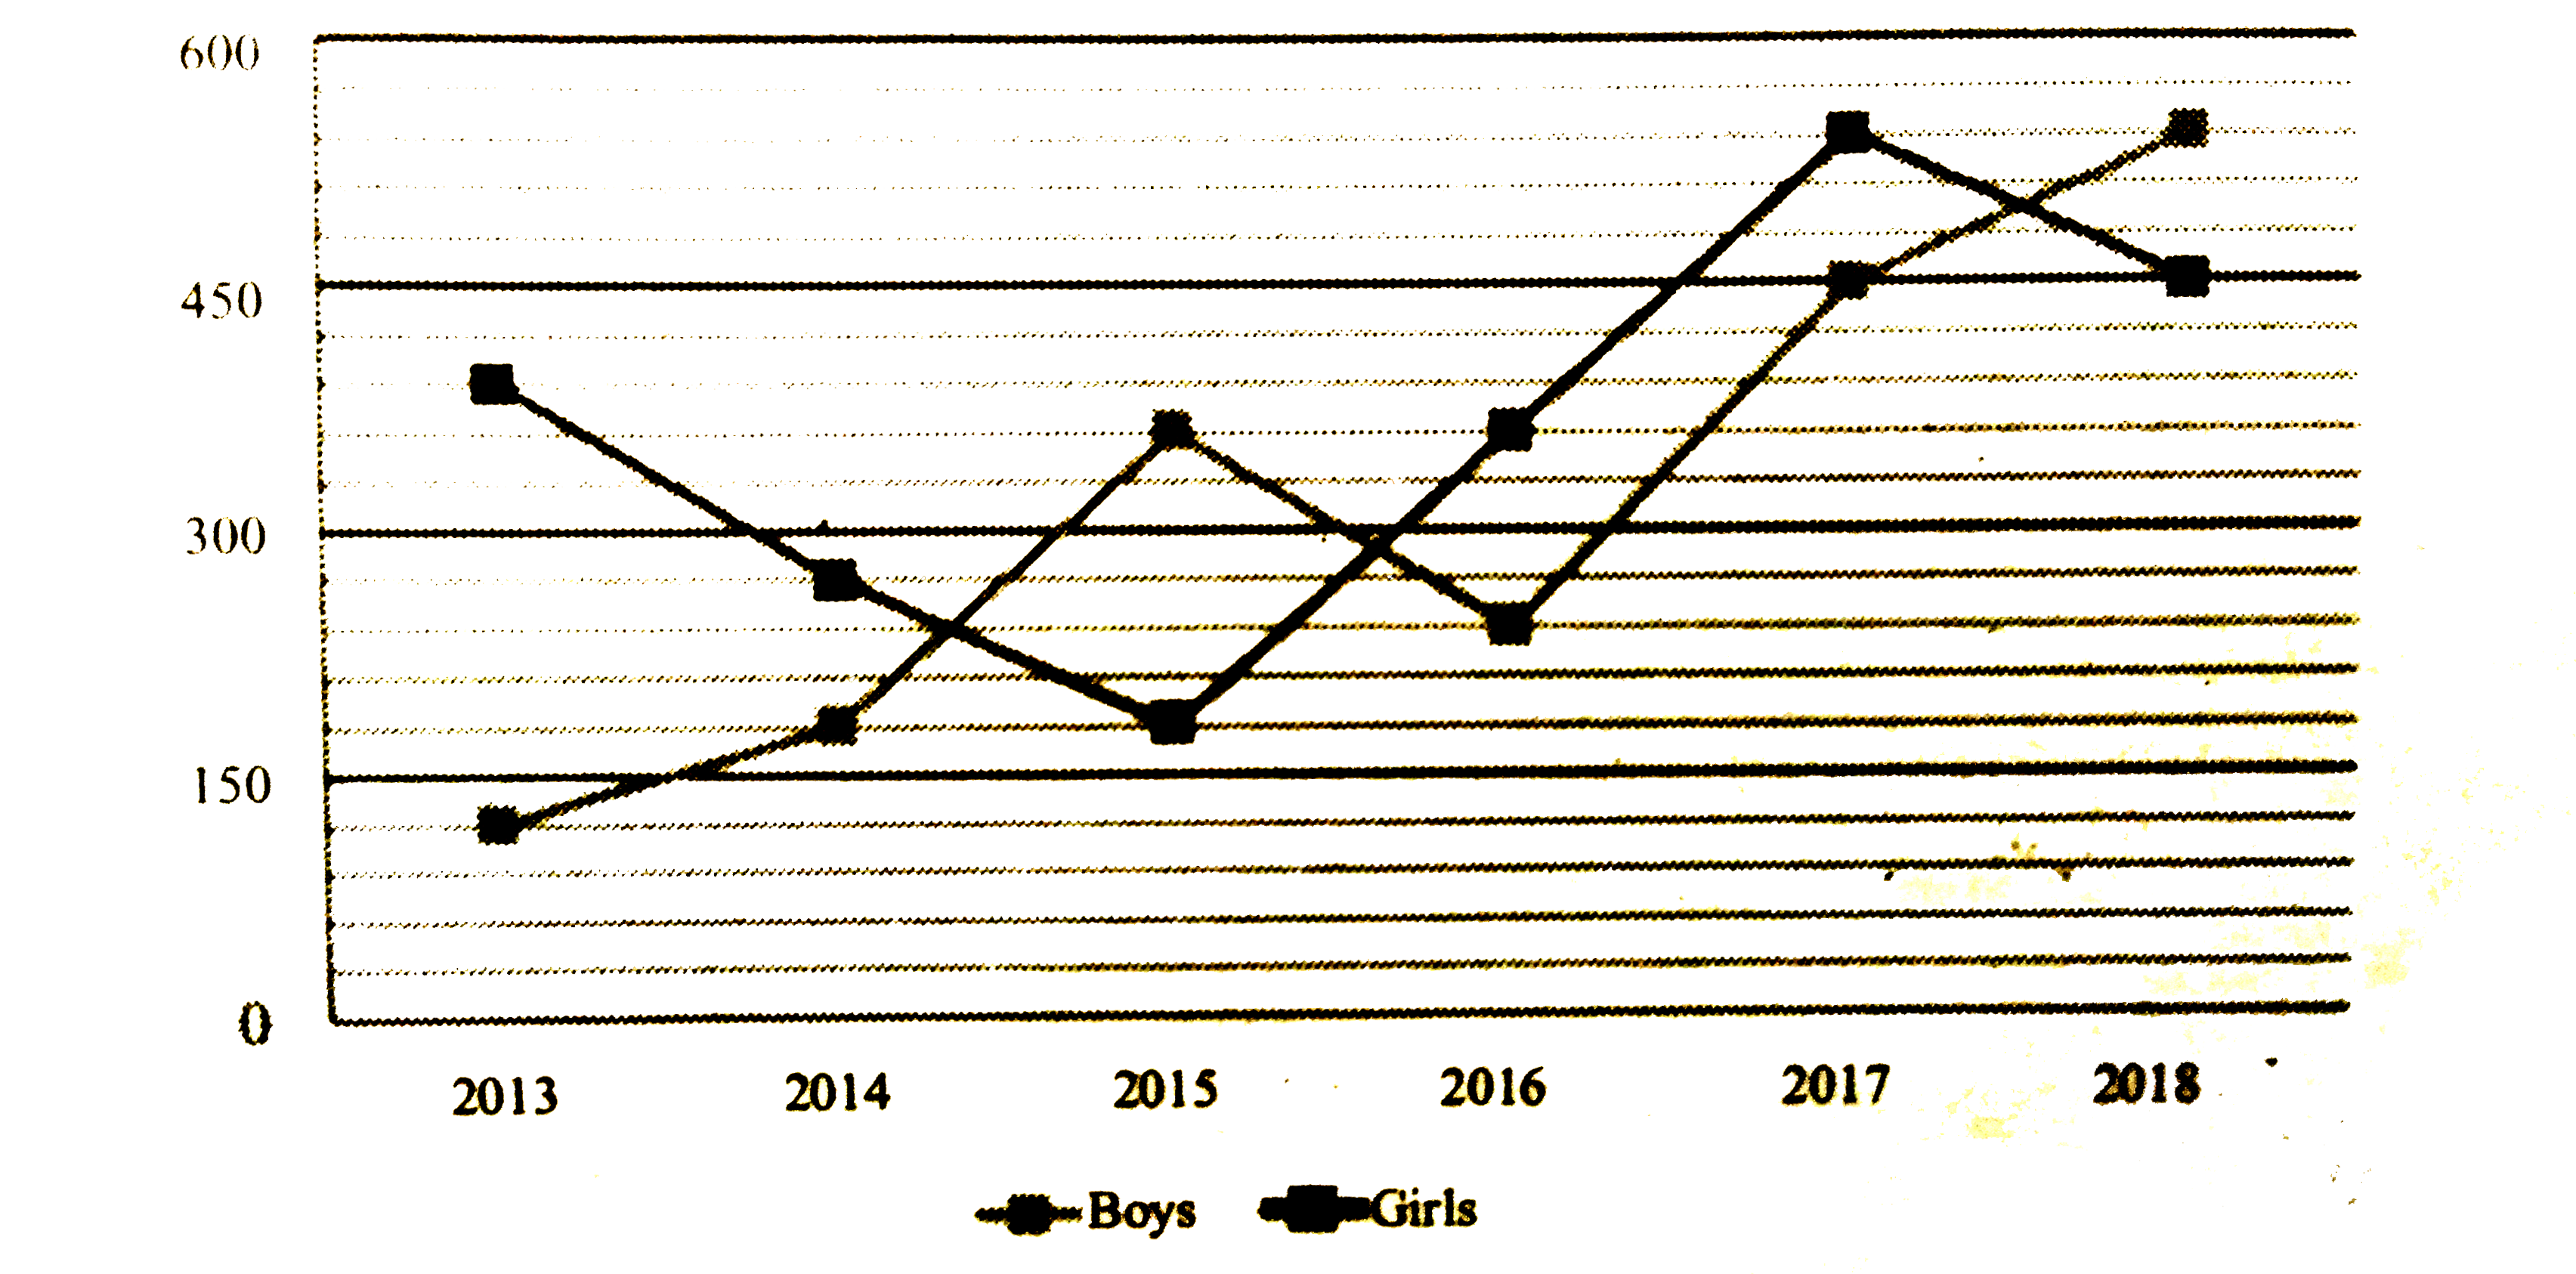
Total number of Boys working 2014 and 2015 together is what percent of the total number of Boys+ Girls working in 2016 ?View SolutionThe bar chart given below shows the number of staff in college A and B from years 2011 to 2016.
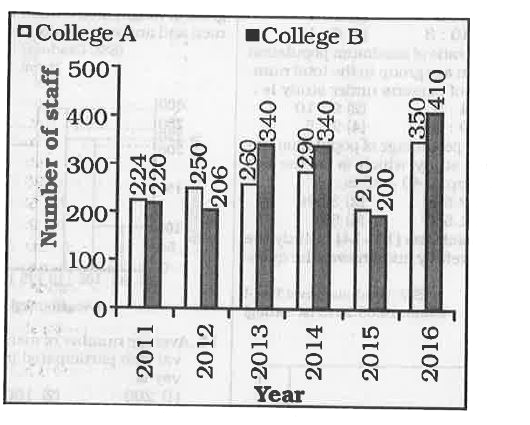
The number of staff in college A in year 2015 is how much per cent nmore than the number of staff in college B in year 2015?View SolutionThe Bar graph given below presents the number of books sold by a bookseller during different months of a year.
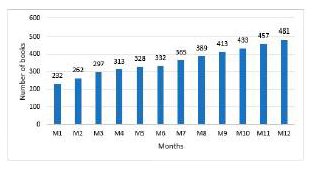
What is the total number of books sold by the bookseller in the year?View Solution

