There are six taxi companies (A, B, C, D, E, F) in a certain city. The bar graph shows the number of taxis run by each of these six companies. Study the diagram and answer the following questions.
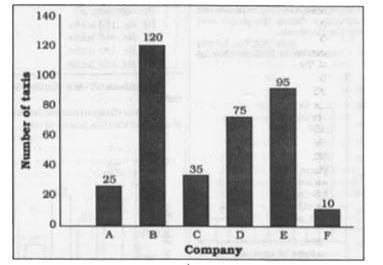
If 30 taxis quit company B and joined company D then D will have how many more taxis than C?
a)40
b)30
c)110
d)70
The correct Answer is:D
Step by step video & image solution for There are six taxi companies (A, B, C, D, E, F) in a certain city. The bar graph shows the number of taxis run by each of these six companies. Study the diagram and answer the following questions. If 30 taxis quit company B and joined company D then D will have how many more taxis than C? by Maths experts to help you in doubts & scoring excellent marks in Class 14 exams.
Updated on:21/07/2023Topper's Solved these Questions
- STATISTICS AND DATA INTERPRETATIONBOOK - KIRAN PUBLICATIONCHAPTER - STATISTICS AND DATA INTERPRETATIONEXERCISE - TYPE-III
39 Videos
- STATISTICS AND DATA INTERPRETATIONBOOK - KIRAN PUBLICATIONCHAPTER - STATISTICS AND DATA INTERPRETATIONEXERCISE - TYPE-IV
182 Videos
- STATISTICS AND DATA INTERPRETATIONBOOK - KIRAN PUBLICATIONCHAPTER - STATISTICS AND DATA INTERPRETATIONEXERCISE - TYPE-VIII
8 Videos
- SIMPLIFICATIONBOOK - KIRAN PUBLICATIONCHAPTER - SIMPLIFICATIONEXERCISE - TEST YOURSELF
25 Videos
- TIME AND DISTANCEBOOK - KIRAN PUBLICATIONCHAPTER - TIME AND DISTANCEEXERCISE - Type -XI
74 Videos
Similar Questions
There are six taxi companies (A, B, C, D, E, F) in a certain city. The bar graph shows the number of taxis run by each of these six companies. Study the diagram and answer the following questions.
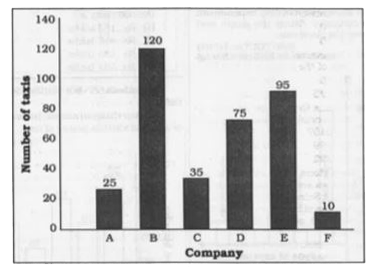
Which taxi company has more taxis A but les than D?
View SolutionThere are six taxi companies (A, B, C, D, E, F) in a certain city. The bar graph shows the number of taxis run by each of these six companies. Study the diagram and answer the following questions.
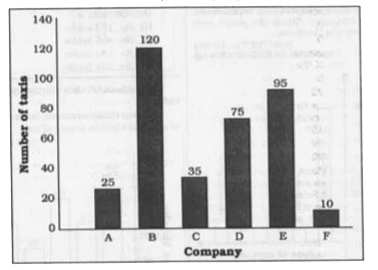
Even if A and C decide to merge, still D will have how many more taxis (in %) than the merged A and C entity?
View Solution
Knowledge Check
The bar graph shows the annual sales of the different departments of a company. Study the diagram and answer the following questions.
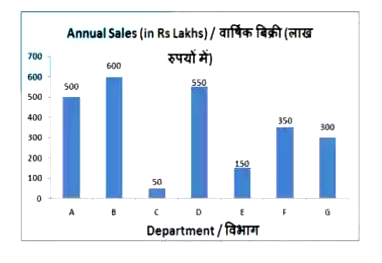
Which department has the second highest annual sales?ADBACBDFThe line graph shows the number of vacancies for executives in a certain company. Study the diagram and answer the following questions.
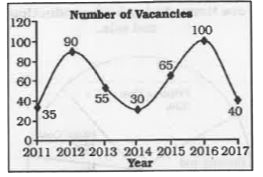
The number of vacancies in 2014 was lesser than that in 2016 by ___.A1.167B0.7C0.6D2.333The bar graph shows the monthly profits of the different departments of a company. Study the diagram and answer the following questions.
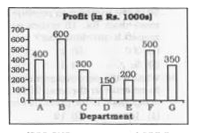
Which department has the second lowest monthly profit?ACBDCEDG
There are six taxi companies (A, B, C, D, E, F) in a certain city. The bar graph shows the number of taxis run by each of these six companies. Study the diagram and answer the following questions.
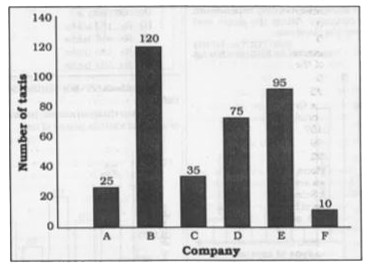
If each taxi on an average runs 100 kms every day and if fuel cost in Rs. 3 per km, then all these taxis spend how much (in Rs.) on fuel every day?
View SolutionThe line graph shows the exports by a certain company. Study the diagram and answer the following questions.
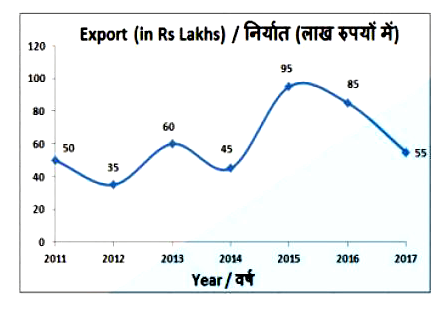
What were the total exports (in Rs lakhs) by the company in the last four years?
View SolutionThe line graph shows the exprots by a certain company. Study the diagram and answer the following questions.
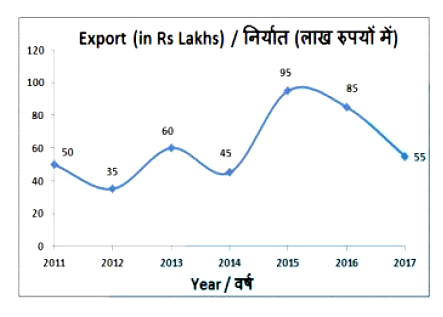
In which year were the exports greater than that of the previous year?
View SolutionThe line graph shows the exprots by a certain company. Study the diagram and answer the following questions.
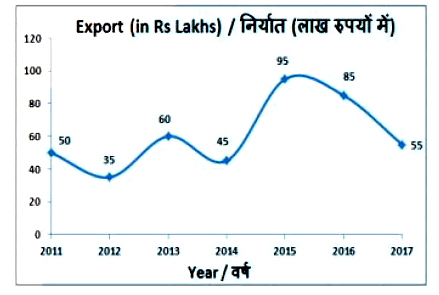
The exports in 2014 were lesser than that in 2011 by ________.
View SolutionThe bar graph shows the production of the different departments of a company. Study the diagram and answer the following questions.
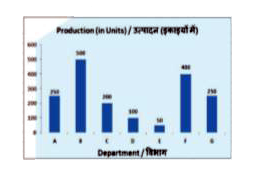
Which department has the second lowest production in units ?
View Solution
