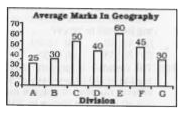
The bar graph shows average marks scored in a 100 marks Geography exam by students of 7 divisions of Standard X. Study the diagram and answer the following questions.
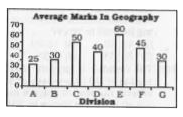
What is the ratio of average marks scored by Division C to Division G?
a)3:5
b)5:3
c)6:5
d)5:6
The correct Answer is:B
Step by step video, text & image solution for The bar graph shows average marks scored in a 100 marks Geography exam by students of 7 divisions of Standard X. Study the diagram and answer the following questions. What is the ratio of average marks scored by Division C to Division G? by Maths experts to help you in doubts & scoring excellent marks in Class 14 exams.
Topper's Solved these Questions
- BOOK - KIRAN PUBLICATIONCHAPTER - STATISTICS AND DATA INTERPRETATIONEXERCISE - TYPE-III39videos
STATISTICS AND DATA INTERPRETATION
- BOOK - KIRAN PUBLICATIONCHAPTER - STATISTICS AND DATA INTERPRETATIONEXERCISE - TYPE-IV182videos
STATISTICS AND DATA INTERPRETATION
- BOOK - KIRAN PUBLICATIONCHAPTER - STATISTICS AND DATA INTERPRETATIONEXERCISE - TYPE-VIII8videos
STATISTICS AND DATA INTERPRETATION
- BOOK - KIRAN PUBLICATIONCHAPTER - SIMPLIFICATIONEXERCISE - TEST YOURSELF25videos
SIMPLIFICATION
- BOOK - KIRAN PUBLICATIONCHAPTER - TIME AND DISTANCEEXERCISE - Type -XI74videos
TIME AND DISTANCE
Similar Questions
The bar graph shows average marks scored in a 100 marks History exam by students of 7 divisions of Standard x. Study the diagram and answer the following questions.
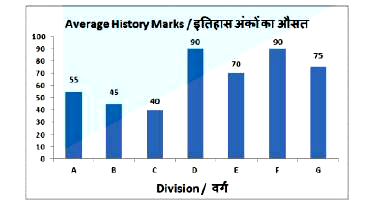
What is the ratio of average marks scored by Division D to Division G?View SolutionThe bar graph shows average marks scored in a 100 marks History exam by students of 7 divisions of Standard x. Study the diagram and answer the following questions.
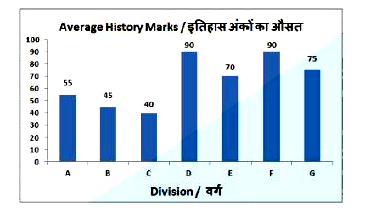
Which division scored the second lowest marks ?View Solution
Knowledge Check
- Question 1 - Select One
The bar graph shows average marks scored in a 100 mark English exam by students of 7 divisions of standard X. Study the diagram and answer the following questions.
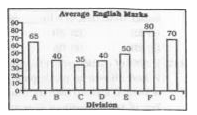
What is the ratio of average marks scored by Division C to Division G?Aa)2:1Bb)1:2Cc)4:7Dd)7:4 - Question 2 - Select One
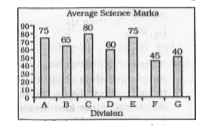
The bar graph shows average marks scored in a 100 mark Science exam by students of 7 divisions of Standard X. Study the diagram and answer the following questions.
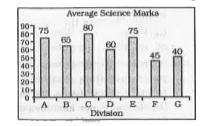
What is the raio of average marks scored by Division D to Division A?A4:5B5:4C4:7D7:4 - Question 3 - Select One
The bar graph shows average marks scored in a 100 mark English exam by students of 7 divisions of standard X. Study the diagram and answer the following questions.
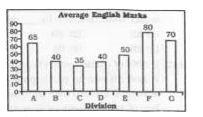
Which division scored the second highest average marks?AFBBCADC
The bar graph shows average marks scored in a 100 marks Science exam by student of 7 divisions of Standard X. Study the diagram and answer the following questions.
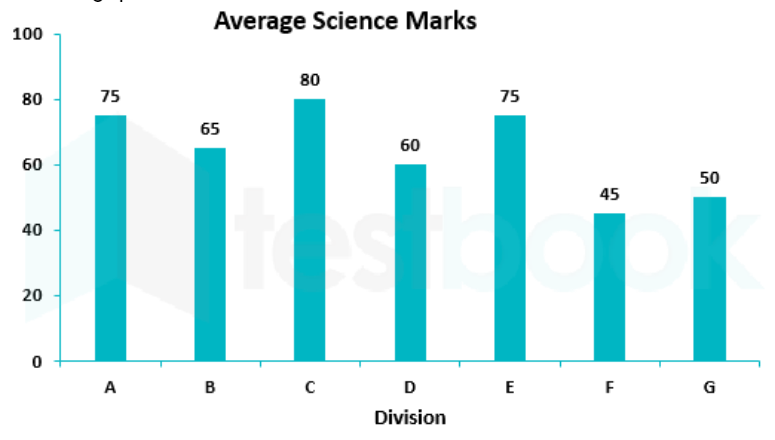
Which division scored the second lowest marks?View SolutionThe bar graph shows average marks scored in a 100 marks Geography exam by students of 7 divisions of Standard X. Study the diagram and answer the following questions.
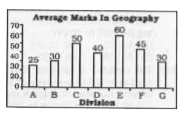
Average marks of divisions A were lesser than that of Division C by ______.View SolutionThe bar graph shows average marks scored in a 100 mark Science exam by students of 7 divisions of Standard X. Study the diagram and answer the following questions.
Marks of division F were lesser than that of Division C byView SolutionThe bar graph shows average marks scored in a 100 mark English exam by students of 7 divisions of standard X. Study the diagram and answer the following questions.

Which division scored the second highest average marks?View SolutionThe bar graph shows average marks scored in a 100 marks Geography exam by students of 7 divisions of Standard X. Study the diagram and answer the following questions.
If all the students of Division C got bonus 10 marks for winnning the inter-school trophy their new average makrs would increase by how much?View Solution

