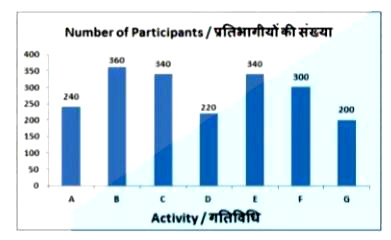
The bar graph shows how many visitors participated in which adventure activity during their stay in an adventure resort. Study the diagram and answer the following questions.
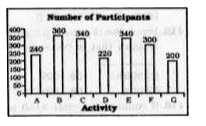
If 30% of participants of activity F had choosen to participate in activity G instead then the number of participants of G would have increased (in per cent) by
90
122.22
45
60
The correct Answer is:C
Step by step video, text & image solution for The bar graph shows how many visitors participated in which adventure activity during their stay in an adventure resort. Study the diagram and answer the following questions. If 30% of participants of activity F had choosen to participate in activity G instead then the number of participants of G would have increased (in per cent) by by Maths experts to help you in doubts & scoring excellent marks in Class 14 exams.
Topper's Solved these Questions
- BOOK - KIRAN PUBLICATIONCHAPTER - STATISTICS AND DATA INTERPRETATIONEXERCISE - TYPE-III39videos
STATISTICS AND DATA INTERPRETATION
- BOOK - KIRAN PUBLICATIONCHAPTER - STATISTICS AND DATA INTERPRETATIONEXERCISE - TYPE-IV182videos
STATISTICS AND DATA INTERPRETATION
- BOOK - KIRAN PUBLICATIONCHAPTER - STATISTICS AND DATA INTERPRETATIONEXERCISE - TYPE-VIII8videos
STATISTICS AND DATA INTERPRETATION
- BOOK - KIRAN PUBLICATIONCHAPTER - SIMPLIFICATIONEXERCISE - TEST YOURSELF25videos
SIMPLIFICATION
- BOOK - KIRAN PUBLICATIONCHAPTER - TIME AND DISTANCEEXERCISE - Type -XI74videos
TIME AND DISTANCE
Similar Questions
Read the bar graph carefully and answer the following questions.
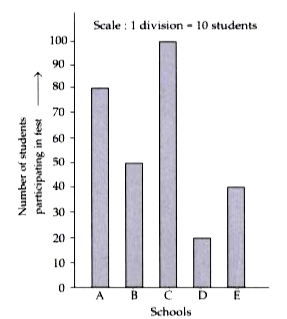 From which school maximum number of students participated ?View Solution
The bar graph shows the number of cars of different brands sold by a dealer in a month. Study the diagram and answer the following question.
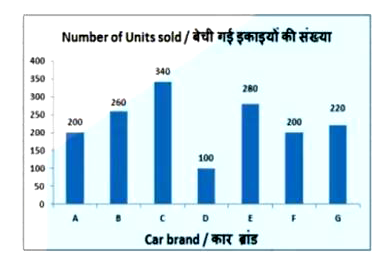
What is the ratio of units sold of brand G to that of brand E?View Solution
Knowledge Check
- Question 1 - Select One
The bar graph shows how many visitors participated in which adventure activity during their stay in an adventure resort. Study the diagram and answer the following questions.
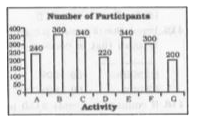
What is the ratio of participants of activity G to participants of activity B?A9:5B12:7C5:9D7:12 - Question 2 - Select One
The bar graph shows how many visitors participated in which adventure activity during their stay in an adventure resort. Study the diagram and answer the following questions.
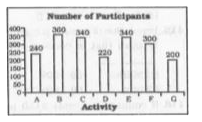
Which adventure activity had the second lowest number of participants?AFBACDDG - Question 3 - Select One
The bar graph shows how many visitors participated in which adventure activity during their stay in an adventure resort. Study the diagram and answer the following questions.
Participants of activity A were lesser than that of F by ____%.Aa)25Bb)30Cc)20Dd)35
The bar graph shows results of a survey carried out within a health club. The members of the club were asked which energy drink they consumed? Study the diagram and answer the following question.
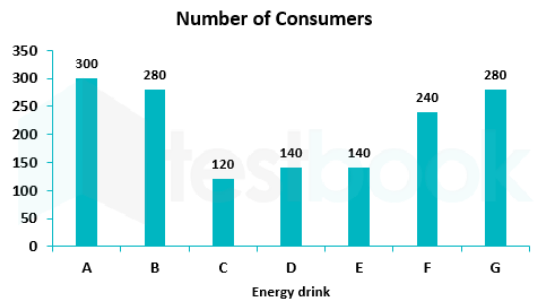
If 40% of consumers of drink C start consuming drink F then the consumers of drink F would increase by_____.View SolutionThe bar graph shows how many visitors participated in which adventure activity during their stay in an adventure resort. Study the diagram and answer the following questions.
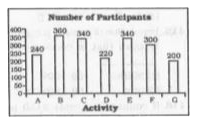
Which adventure activity has the second lowest number of participants?View SolutionThe bar graph shows the number of employees working in the different departments of a company. Study the diagram and answer the following questions.
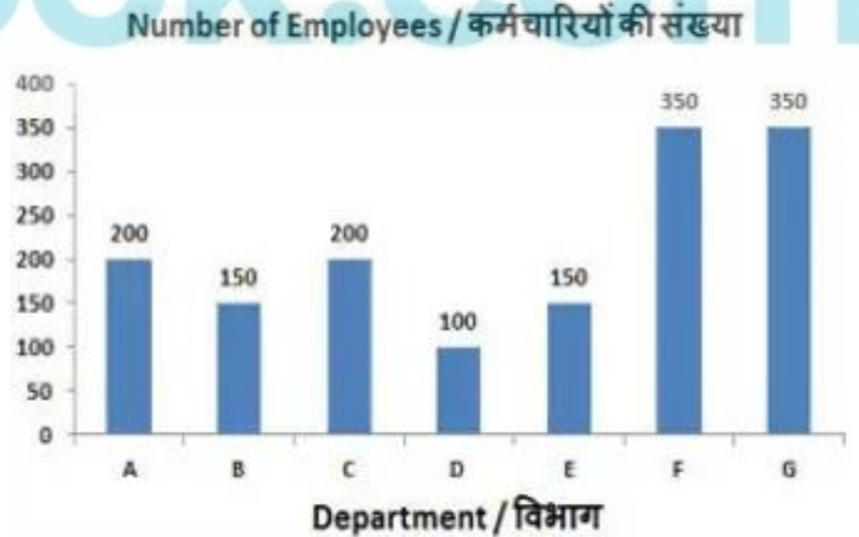
The number of employees of department G are greater than those of department C by ________.View SolutionThe bar graph shows results of a survey. 1500 people exiting multiplex were asked which movie they watched? Study the diagram and answer the following questions?
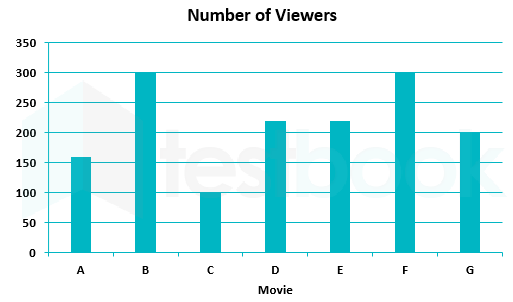
Which movie had least number of viewers?View SolutionThe pie chart graphs shows the number of seats that each party has in the lower house of the parliament. Study the diagram and answer the following questions.
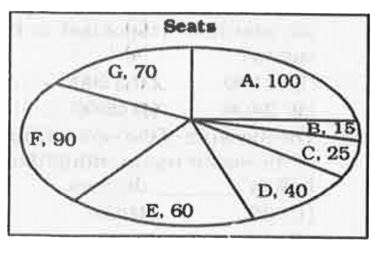
If parties D, E and F form a coalition they would be still short of how many seats to reach the half way mark?View Solution

