The bar chart given below shows the percentage distribution of the production of various models of a ,mobile manufacturing company in 2007 and 2008. The total production in 2007 was 35 lakh mobile phones and in 2008 the production was 44 lakh. Study the chart and answer the following questions.
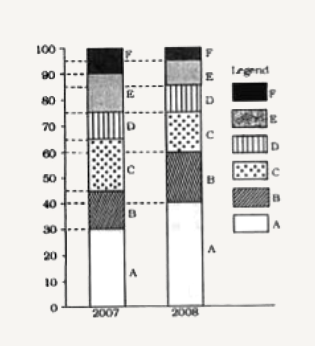
What was the difference in the number of B type mobiles produced in 2007 and 2008 ?
3,55,000
2,70,000
2,25,000
1,75,000
The correct Answer is:A
Step by step video & image solution for The bar chart given below shows the percentage distribution of the production of various models of a ,mobile manufacturing company in 2007 and 2008. The total production in 2007 was 35 lakh mobile phones and in 2008 the production was 44 lakh. Study the chart and answer the following questions. What was the difference in the number of B type mobiles produced in 2007 and 2008 ? by Maths experts to help you in doubts & scoring excellent marks in Class 14 exams.
Updated on:21/07/2023Topper's Solved these Questions
- STATISTICS AND DATA INTERPRETATIONBOOK - KIRAN PUBLICATIONCHAPTER - STATISTICS AND DATA INTERPRETATIONEXERCISE - TYPE-IV
182 Videos
- STATISTICS AND DATA INTERPRETATIONBOOK - KIRAN PUBLICATIONCHAPTER - STATISTICS AND DATA INTERPRETATIONEXERCISE - TYPE-V
38 Videos
- STATISTICS AND DATA INTERPRETATIONBOOK - KIRAN PUBLICATIONCHAPTER - STATISTICS AND DATA INTERPRETATIONEXERCISE - TYPE-II
131 Videos
- SIMPLIFICATIONBOOK - KIRAN PUBLICATIONCHAPTER - SIMPLIFICATIONEXERCISE - TEST YOURSELF
25 Videos
- TIME AND DISTANCEBOOK - KIRAN PUBLICATIONCHAPTER - TIME AND DISTANCEEXERCISE - Type -XI
74 Videos
Similar Questions
The bar chart given below shows the percentage distribution of the production of various models of a ,mobile manufacturing company in 2007 and 2008. The total production in 2007 was 35 lakh mobile phones and in 2008 the production was 44 lakh. Study the chart and answer the following questions.
If the percentage production of A type mobiles in 2008 was same as that in 2007, then the number of A type mobiles produced in 2008 would have been
View SolutionThe bar chart given below shows the percentage distribution of the production of various models of a ,mobile manufacturing company in 2007 and 2008. The total production in 2007 was 35 lakh mobile phones and in 2008 the production was 44 lakh. Study the chart and answer the following questions.
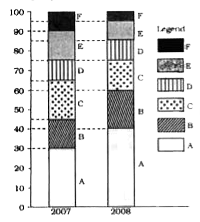
For which models was the percentage variation in production from 2007 to 2008 the maximum ?
View Solution
Knowledge Check
Study the following graph carefully and answer the questions given below
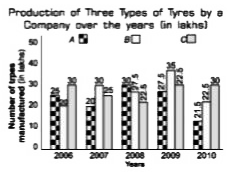
What was the difference between the number of B type tyres manufactured in 2008 and 2009?A100000B2000000C1000000Dnone to theseStudy the following graph carefully and answer the questions given below
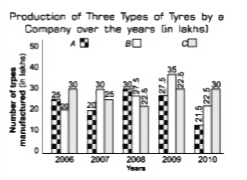
What was the percentage drop in the number of C type tyres manufactured from 2007 to 2008?A25%B10%C15%D2.5%The below table gives rice production in each year. Read and answer the following questions
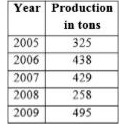
What was the decline in production in year 2008 compared to 2007 ?
A 40%
B 51%
C 67%
D 45%ADBACCDB
The bar chart given below shows the percentage distribution of the production of various models of a ,mobile manufacturing company in 2007 and 2008. The total production in 2007 was 35 lakh mobile phones and in 2008 the production was 44 lakh. Study the chart and answer the following questions.
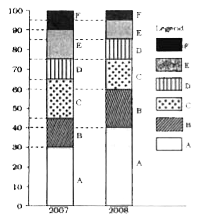
If 85% of the D type mobiles prodeced in each year were sold by the company, how many D type mobiles remained unsold ?
View SolutionThe below table gives rice production in each year. Read and answer the following questions.
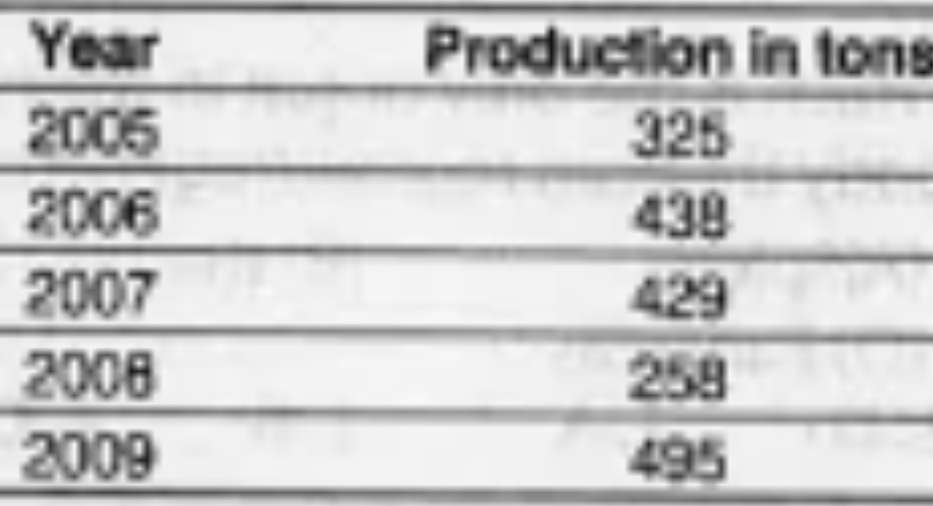
Whatwasthe decline in production in year 2008 compared to 2007?
40%
51%
67%
45%
View SolutionStudy the following graph and answer questions
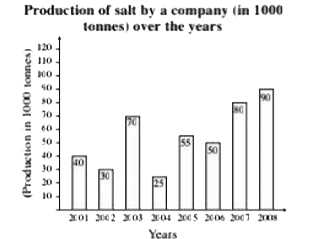
What was the percentage increase in production of salt in 2008 compared to that of 2001?
View SolutionStudy the following graph and answer the questions given below it.
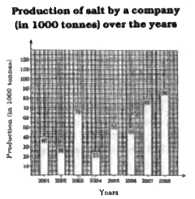
What was the percentage increase in production of salt in 2008 compared to that of 2001 ?
View SolutionThe pie chart shows the breakup of expenditure of a manufacturing company for the year 2017. Study the diagram and answer the following questions.
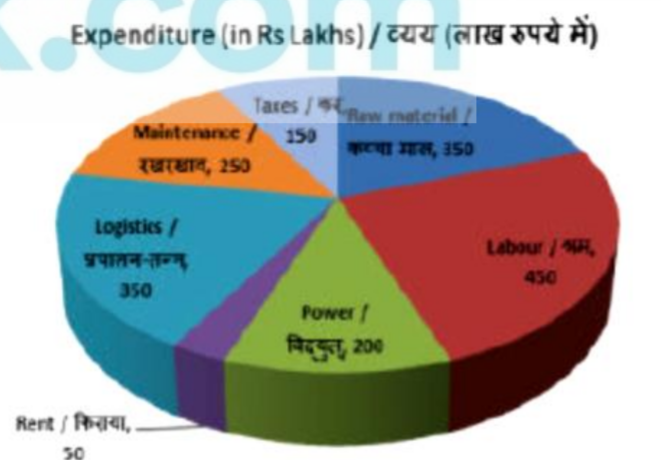
What is the total expenditure (in Rs lakhs)?
View Solution
