The production figures of a perfume manufacture are given in the form of percenatge in sub-divided bar diagram. Study the diagram and answer the questions.
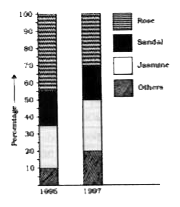
What is the production of jasmine perfume in the year 1997? Given that during the year 1997 total perfumed production was 5000 units.
1200
2500
2000
1500
The correct Answer is:D
Step by step video, text & image solution for The production figures of a perfume manufacture are given in the form of percenatge in sub-divided bar diagram. Study the diagram and answer the questions. What is the production of jasmine perfume in the year 1997? Given that during the year 1997 total perfumed production was 5000 units. by Maths experts to help you in doubts & scoring excellent marks in Class 14 exams.
Updated on:21/07/2023Topper's Solved these Questions
- STATISTICS AND DATA INTERPRETATIONBOOK - KIRAN PUBLICATIONCHAPTER - STATISTICS AND DATA INTERPRETATIONEXERCISE - TYPE-IV
182 Videos
- STATISTICS AND DATA INTERPRETATIONBOOK - KIRAN PUBLICATIONCHAPTER - STATISTICS AND DATA INTERPRETATIONEXERCISE - TYPE-V
38 Videos
- STATISTICS AND DATA INTERPRETATIONBOOK - KIRAN PUBLICATIONCHAPTER - STATISTICS AND DATA INTERPRETATIONEXERCISE - TYPE-II
131 Videos
- SIMPLIFICATIONBOOK - KIRAN PUBLICATIONCHAPTER - SIMPLIFICATIONEXERCISE - TEST YOURSELF
25 Videos
- TIME AND DISTANCEBOOK - KIRAN PUBLICATIONCHAPTER - TIME AND DISTANCEEXERCISE - Type -XI
74 Videos
Similar Questions
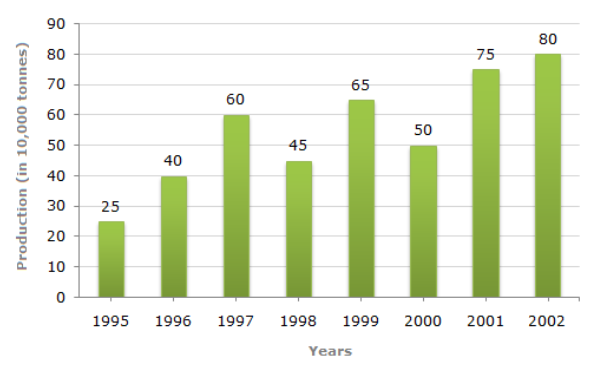
Study the bar chart and answer the question based on it. In how many of the given years was the production of fertilizers less than the average production of the given years?
View SolutionStudy the following graph to answer the given questions -----
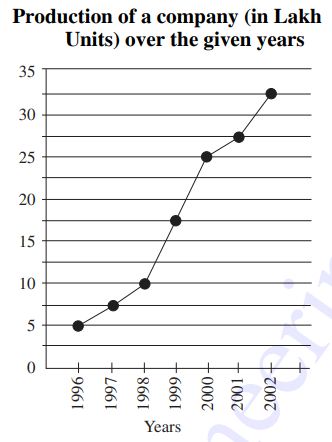
What is the approximate average production (in lakhs) for the given years ?
View Solution
Knowledge Check
The production figures of a perfume manufacture are given in the form of percentage in sub-divided bar diagram. Study the diagram and answer the questions.
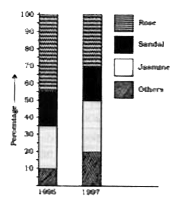
What is the percentage of sandal perfume during the year 1995 over that during 1997 ?A100%B1%C0%D50%The production figures of a perfume manufacture are given in the form of percenatge in sub-divided bar diagram. Study the diagram and answer the questions.
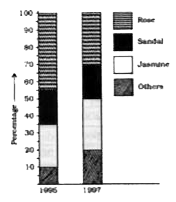
What is the ratio of percentage production of rose perfume during 1995 to that during the year 1997 ?A4:3B3:2C2:3D5:4Study the graph and answer the following questions-
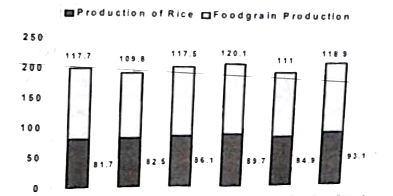
Over the given years what is average production of rice?A86.33 million tonnesB88.66 million tonnesC85 million tonnesD88 million tonnes
The bar graph shows the production of the different departments of a company. Study the diagram and answer the following questions.
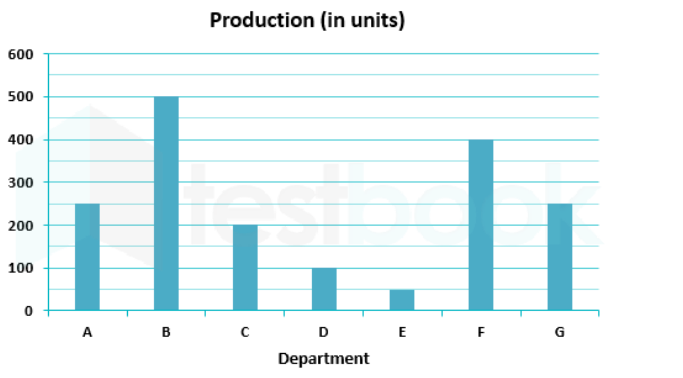
What is the ratio of production of department A to that of department F?
View SolutionThe pie chart shows the breakup of expenditure of a manufacturing company for the year 2017. Study the diagram and answer the following questions.
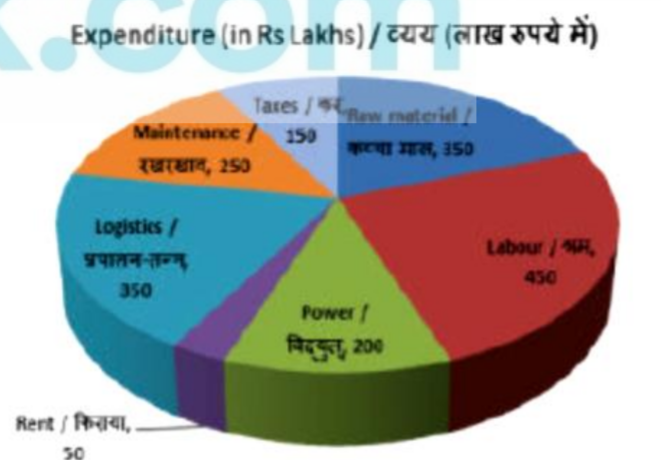
What is the total expenditure (in Rs lakhs)?
View SolutionThe pie chart shows the breakup of expendoture of a manufacturing company for the year 2017. Study the diagram and answer the following questions.
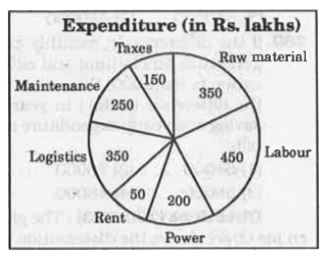
What is the total expenditure (in Rs. lakhs)?
View SolutionStudy the following bar-diagram and answer the questions.
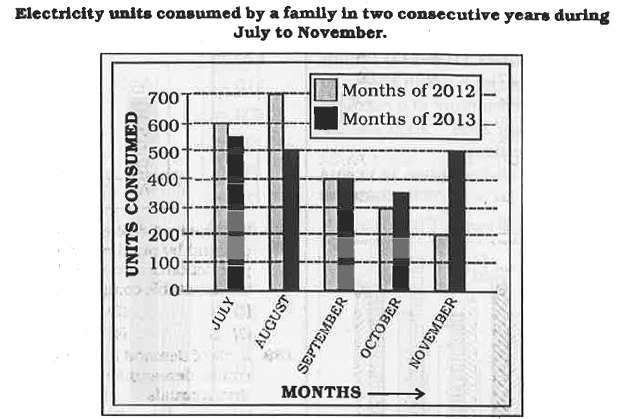
The total units consumption in the year 2013 during these 5 months, in respect of the same in the previous year has been
View SolutionThe line graph shows the production of steel of a certain country. Study the diagram and answer the following questions.
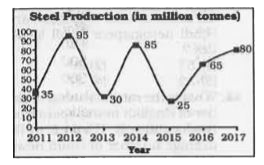
In which year was the steel production lesser than that of the previous year?
View Solution
