The bar chart given below shows the percentage distribution of the production of various models of a mobile manufacturing company in 2007 and 2008 The total production in 2007 was 35 lakh mobile phones and in 2008 the production was 44 lakh Study the chart and answer the following questions
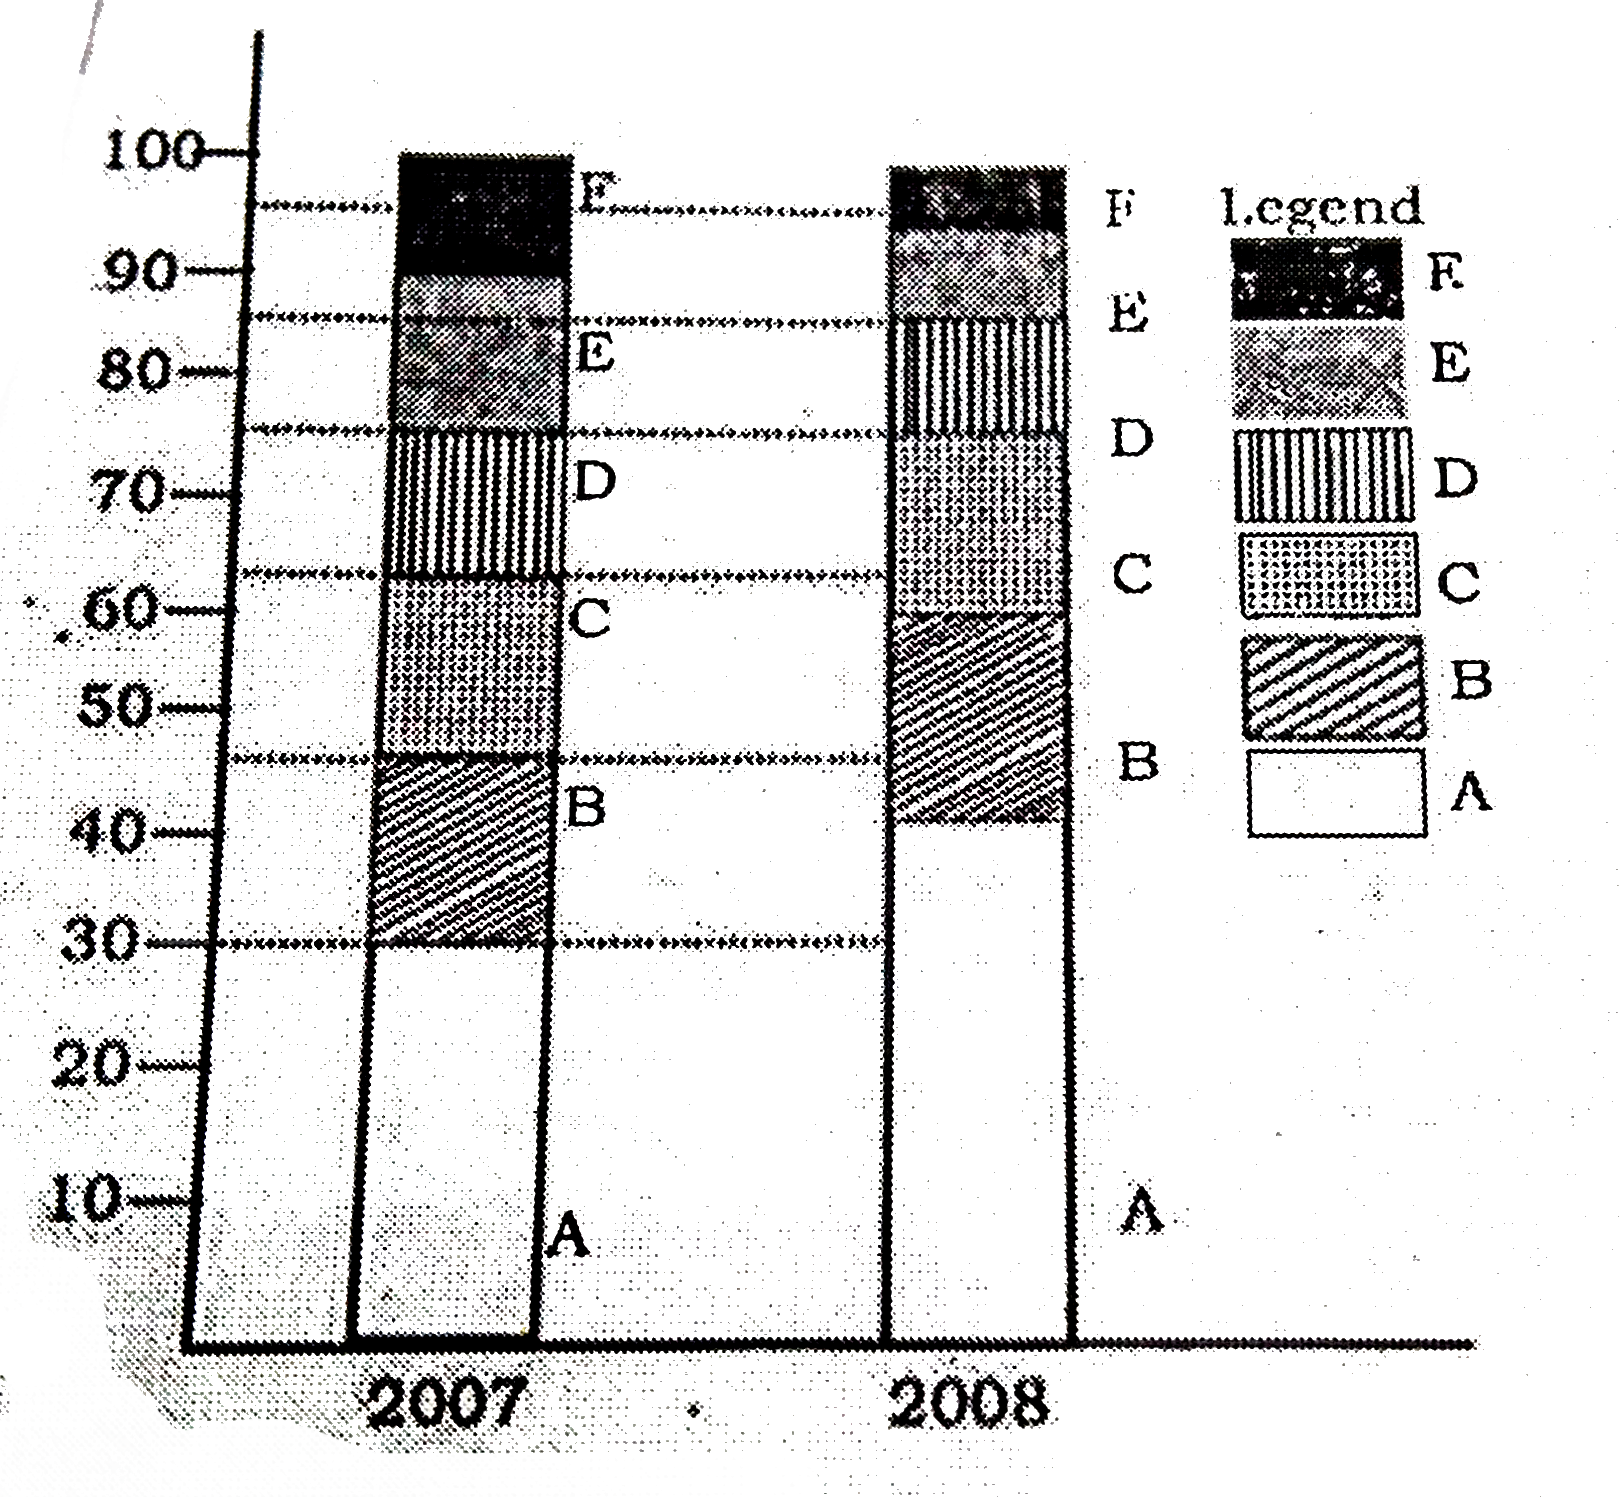
वर्ष 2007 में मॉडल A, B तथा E का कुल उत्पादन कितना है ।
24,50,000
22,75,000
21,00,000
19,25,000
The correct Answer is:C
Step by step video solution for The bar chart given below shows the percentage distribution of the production of various models of a mobile manufacturing company in 2007 and 2008 The total production in 2007 was 35 lakh mobile phones and in 2008 the production was 44 lakh Study the chart and answer the following questions वर्ष 2007 में मॉडल A, B तथा E का कुल उत्पादन कितना है । by Maths experts to help you in doubts & scoring excellent marks in Class 14 exams.
Updated on:21/07/2023Topper's Solved these Questions
- STATISTICS AND DATA INTERPRETATIONBOOK - KIRAN PUBLICATIONCHAPTER - STATISTICS AND DATA INTERPRETATIONEXERCISE - TYPE-IV
182 Videos
- STATISTICS AND DATA INTERPRETATIONBOOK - KIRAN PUBLICATIONCHAPTER - STATISTICS AND DATA INTERPRETATIONEXERCISE - TYPE-V
38 Videos
- STATISTICS AND DATA INTERPRETATIONBOOK - KIRAN PUBLICATIONCHAPTER - STATISTICS AND DATA INTERPRETATIONEXERCISE - TYPE-II
131 Videos
- SIMPLIFICATIONBOOK - KIRAN PUBLICATIONCHAPTER - SIMPLIFICATIONEXERCISE - TEST YOURSELF
25 Videos
- TIME AND DISTANCEBOOK - KIRAN PUBLICATIONCHAPTER - TIME AND DISTANCEEXERCISE - Type -XI
74 Videos
Similar Questions
The bar chart given below shows the percentage distribution of the production of various models of a ,mobile manufacturing company in 2007 and 2008. The total production in 2007 was 35 lakh mobile phones and in 2008 the production was 44 lakh. Study the chart and answer the following questions.
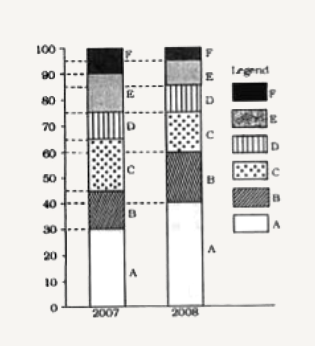
What was the difference in the number of B type mobiles produced in 2007 and 2008 ?
View SolutionThe bar chart given below shows the percentage distribution of the production of various models of a ,mobile manufacturing company in 2007 and 2008. The total production in 2007 was 35 lakh mobile phones and in 2008 the production was 44 lakh. Study the chart and answer the following questions.
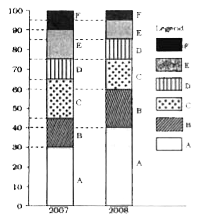
If 85% of the D type mobiles prodeced in each year were sold by the company, how many D type mobiles remained unsold ?
View Solution
Knowledge Check
Study the bar graph and answer the question that follows.
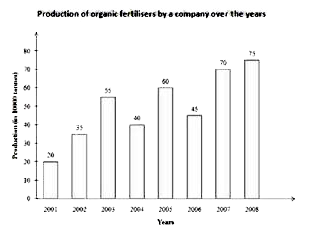
The ratio of the total production of organic fertilizers by the company in the years 2005. 2006 and 2008 to the total production in the years 2001, 2002, 2003 and 2004. is:A5:6B4:3C6:5D3:4Study the following graph carefully and answer the questions given below
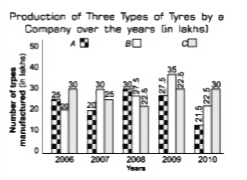
What was the percentage drop in the number of C type tyres manufactured from 2007 to 2008?A25%B10%C15%D2.5%
The bar chart given below shows the percentage distribution of the production of various models of a ,mobile manufacturing company in 2007 and 2008. The total production in 2007 was 35 lakh mobile phones and in 2008 the production was 44 lakh. Study the chart and answer the following questions.
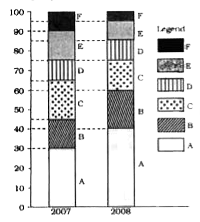
For which models was the percentage variation in production from 2007 to 2008 the maximum ?
View SolutionThe bar chart given below shows the percentage distribution of the production of various models of a ,mobile manufacturing company in 2007 and 2008. The total production in 2007 was 35 lakh mobile phones and in 2008 the production was 44 lakh. Study the chart and answer the following questions.
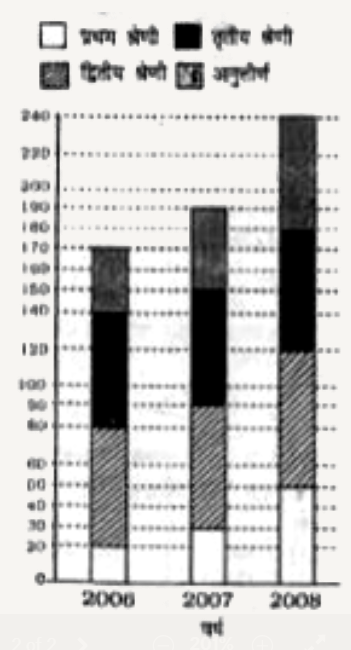
If the percentage production of A type mobiles in 2008 was same as that in 2007, then the number of A type mobiles produced in 2008 would have been
View SolutionFor which of the following years, the percentage rise or fall in production from the previous year is the maximum for Company Y ? (a) 2007 (b) 2008 (c) 2009 (d) 2010 (e) 2007 and 2010
View SolutionThe given pie chart shows the quantity wise sales distribution of five products (A, B, C, D and E) of a company in 2016.
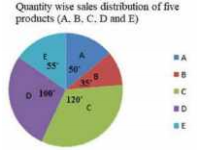 In 2016, if a total of 14616 units were sold, then the number of units of products D sold was:
View SolutionThe given pie chart shows the quantity wise sales distribution of five products (A, B, C, D and E) of a company in 2016.
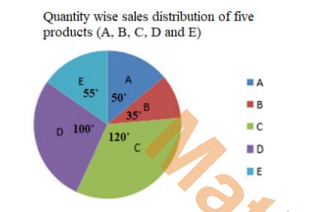 In 2016, if a total of 14616 units were sold, then the number of units of products D sold was:
View SolutionIn which year was the percentage of production of Company Z to the production of Company Y , the maximum? (a) 2006 (b) 2007 (c) 2008 (d) 2009 (e) 2010
View Solution
