Study the following multiple bar graph carefully and answer the questions.
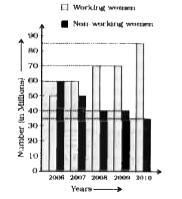
The number of non-working women in the year 2010 was approxiamtely (correct up to an integer) what per cent of total number of working as well as non-working women in that year ?
(a)
(b)
(c)
(d) 0.31
The correct Answer is:C
Step by step video, text & image solution for Study the following multiple bar graph carefully and answer the questions. The number of non-working women in the year 2010 was approxiamtely (correct up to an integer) what per cent of total number of working as well as non-working women in that year ? by Maths experts to help you in doubts & scoring excellent marks in Class 14 exams.
Topper's Solved these Questions
- BOOK - KIRAN PUBLICATIONCHAPTER - STATISTICS AND DATA INTERPRETATIONEXERCISE - TYPE-V38videos
STATISTICS AND DATA INTERPRETATION
- BOOK - KIRAN PUBLICATIONCHAPTER - STATISTICS AND DATA INTERPRETATIONEXERCISE - TYPE-VI86videos
STATISTICS AND DATA INTERPRETATION
- BOOK - KIRAN PUBLICATIONCHAPTER - STATISTICS AND DATA INTERPRETATIONEXERCISE - TYPE-III39videos
STATISTICS AND DATA INTERPRETATION
- BOOK - KIRAN PUBLICATIONCHAPTER - SIMPLIFICATIONEXERCISE - TEST YOURSELF25videos
SIMPLIFICATION
- BOOK - KIRAN PUBLICATIONCHAPTER - TIME AND DISTANCEEXERCISE - Type -XI74videos
TIME AND DISTANCE
Similar Questions
Knowledge Check
- Question 1 - Select One
Study the following multiple bar graph carefully and answer the questions.
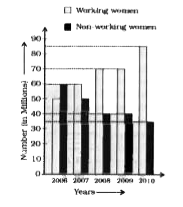
What is the ratio of number of working women to the non-working women in the year 2009 ?A(a) 7:4B(b) 4:7C(c) 2:3D(d) 3:2 - Question 2 - Select One
Study the following multiple bar graph carefully and answer the questions.
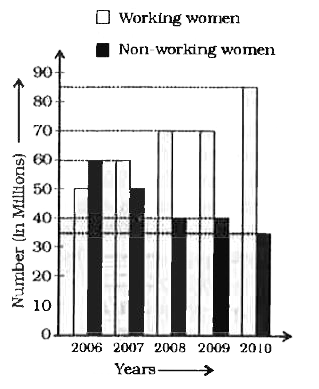
What is the ratio of the number of women working in the year 2006 to the number of women working in the year 2010 ?A5:17B17:5C17:10D10:17 - Question 3 - Select One
Study the following multiple bar graph carefully and answer the questions.

In which year was the difference between the number of working and non-working women the highest?A2007B2008C2009D2010
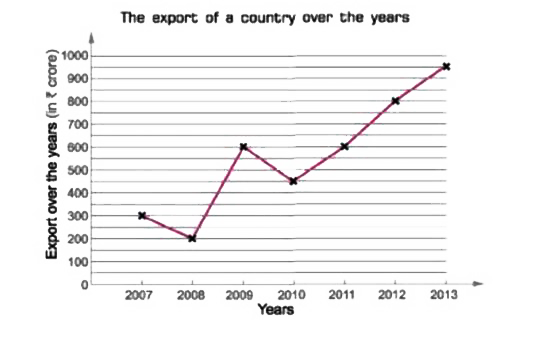
Study the following graph carefully and answer the given questions.
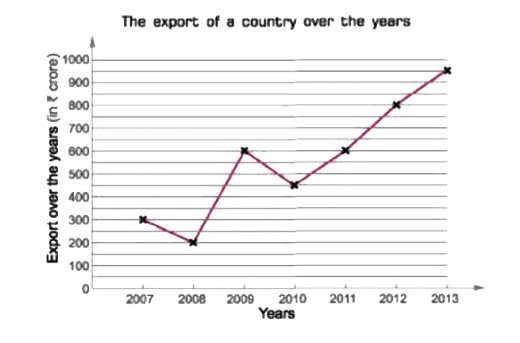
What is the total exports ( in ? Crore) for the given years ?View SolutionStudy the following bar graph carefully to answer the questions.
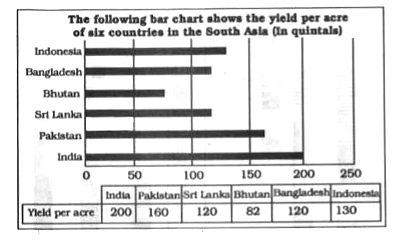
The yield per acre of India is what percent more than that of Pakistan?View SolutionStudy the following graph carefully and answer the given questions.
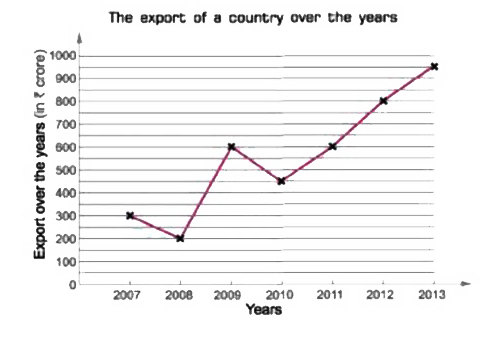
Exports in 2009 is approximately what per cent of that of year 2010 ?View SolutionStudy the following multiple bar graph carefully and answer the questions.
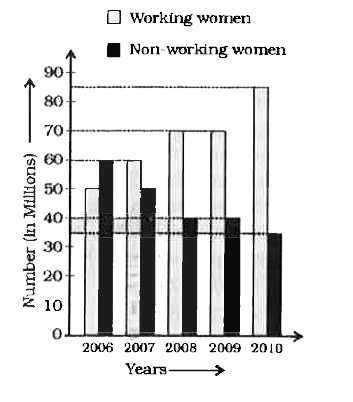
In which year or years, the difference between the number of working and non-working women the lowest ?View SolutionStudy the following bar graph carefully and answer the questions.
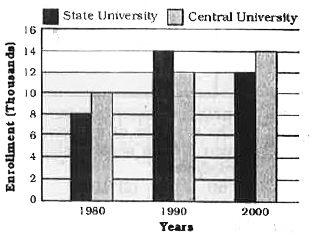
The ratio of the total enrolments in the year 1980 and 2000 at the State University and Central University isView Solution


