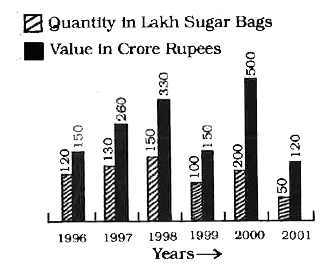
Study the bar diagram and answer the questions.
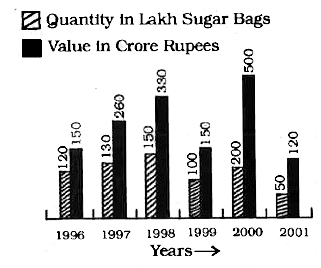
Percentage fall in value from 2000 to 2001 is
25%
50%
76%
40%
The correct Answer is:C
Step by step video, text & image solution for Study the bar diagram and answer the questions. Percentage fall in value from 2000 to 2001 is by Maths experts to help you in doubts & scoring excellent marks in Class 14 exams.
Updated on:21/07/2023Topper's Solved these Questions
- STATISTICS AND DATA INTERPRETATIONBOOK - KIRAN PUBLICATIONCHAPTER - STATISTICS AND DATA INTERPRETATIONEXERCISE - TYPE-V
38 Videos
- STATISTICS AND DATA INTERPRETATIONBOOK - KIRAN PUBLICATIONCHAPTER - STATISTICS AND DATA INTERPRETATIONEXERCISE - TYPE-VI
86 Videos
- STATISTICS AND DATA INTERPRETATIONBOOK - KIRAN PUBLICATIONCHAPTER - STATISTICS AND DATA INTERPRETATIONEXERCISE - TYPE-III
39 Videos
- SIMPLIFICATIONBOOK - KIRAN PUBLICATIONCHAPTER - SIMPLIFICATIONEXERCISE - TEST YOURSELF
25 Videos
- TIME AND DISTANCEBOOK - KIRAN PUBLICATIONCHAPTER - TIME AND DISTANCEEXERCISE - Type -XI
74 Videos
Similar Questions
Knowledge Check
Bar diagram showing the effect of literacy drive within both sexes in 5 units study the bar diagram and answer the questions.
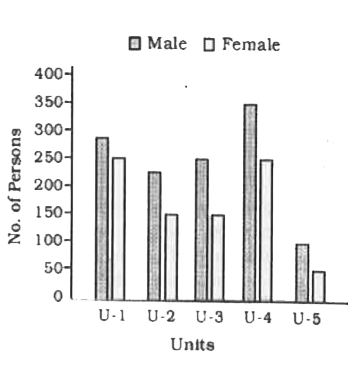
The percentage of males in u - 4 isA50B100C70012D13700Bar diagram showing the effect of literacy drive within both sexes in 5 units study the bar diagram and answer the questions.
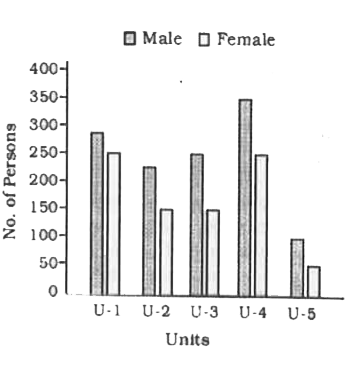
The percentage of females in U - 3 isA30B37.5C35.7D35Study the bar diagram and answer the questions.
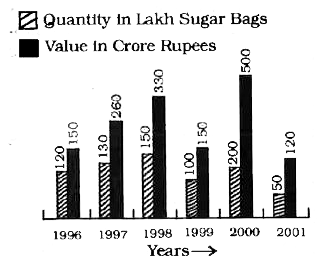
The approximate percentage incresase in value from 1997 to 1998 wasA26.9%B27.8%C26.5%D27.3%
Study the bar diagram and answer the questions.
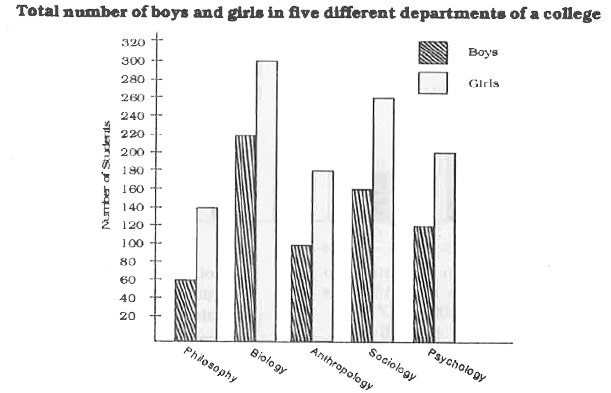
The percentage of the girls from Biology Department compared to the total number of girls from all the other Departments together is
View SolutionStudy the bar diagram and answer the questions.
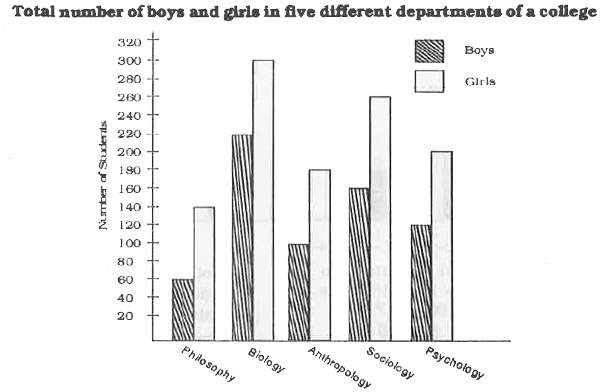
The percentage of the boys from Biology Department compared to the total number of boys from all the other Departments together is
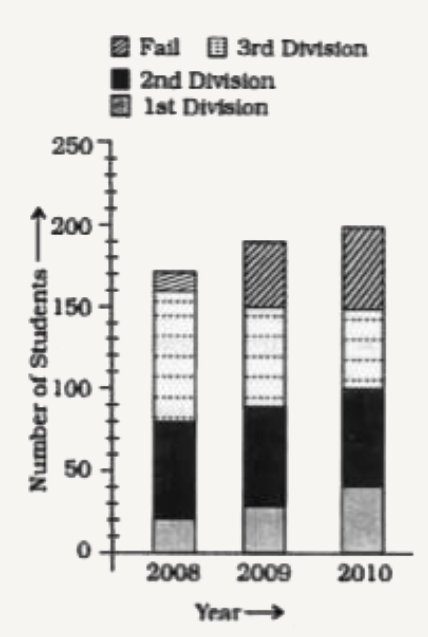
View SolutionDirection : The sub divided bar diagram given below depicts H.S Students of school for three years. Study the diagram and answer the questions.
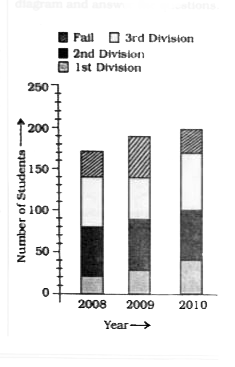
The percentage passed in 1 st division in 2008 was
View SolutionStudy the following bar graph and answer the question that follows.
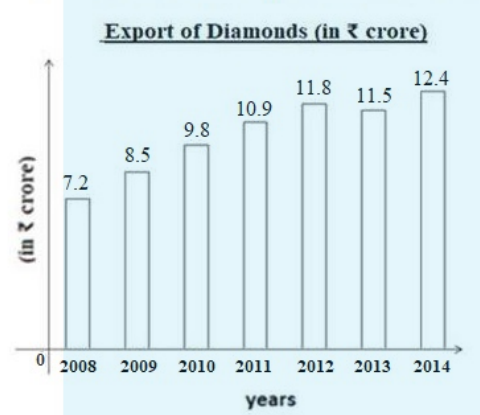
In which year was the maximin percentage increase in diamonds exports compared to the previous year?
View SolutionThe production figures of a perfume manufacture are given in the form of percentage in sub-divided bar diagram. Study the diagram and answer the questions.
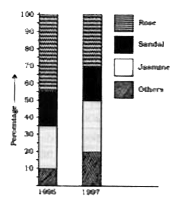
What is the percentage of sandal perfume during the year 1995 over that during 1997 ?
View Solution

