The data given in Bar diagram relate to the department wise admission of 320 students to B.Sc. (Honours) first year classes of a certain college in the given five subjetcs. Study the graph and answer the questions.
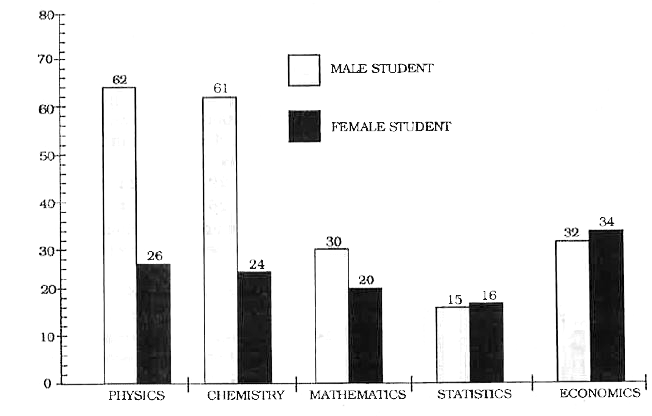
The total number of male students who got admitted in Mathematics and Economics as compared to the total number of female students getting admission in Mathematics and Economics is :
less by 17%
more by 4.2%
more by 18.4%
more by 12.8%
The correct Answer is:C
Step by step video, text & image solution for The data given in Bar diagram relate to the department wise admission of 320 students to B.Sc. (Honours) first year classes of a certain college in the given five subjetcs. Study the graph and answer the questions. The total number of male students who got admitted in Mathematics and Economics as compared to the total number of female students getting admission in Mathematics and Economics is : by Maths experts to help you in doubts & scoring excellent marks in Class 14 exams.
Updated on:21/07/2023Topper's Solved these Questions
- STATISTICS AND DATA INTERPRETATIONBOOK - KIRAN PUBLICATIONCHAPTER - STATISTICS AND DATA INTERPRETATIONEXERCISE - TYPE-V
38 Videos
- STATISTICS AND DATA INTERPRETATIONBOOK - KIRAN PUBLICATIONCHAPTER - STATISTICS AND DATA INTERPRETATIONEXERCISE - TYPE-VI
86 Videos
- STATISTICS AND DATA INTERPRETATIONBOOK - KIRAN PUBLICATIONCHAPTER - STATISTICS AND DATA INTERPRETATIONEXERCISE - TYPE-III
39 Videos
- SIMPLIFICATIONBOOK - KIRAN PUBLICATIONCHAPTER - SIMPLIFICATIONEXERCISE - TEST YOURSELF
25 Videos
- TIME AND DISTANCEBOOK - KIRAN PUBLICATIONCHAPTER - TIME AND DISTANCEEXERCISE - Type -XI
74 Videos
Similar Questions
Read the following information carefully and answer the questions given below.
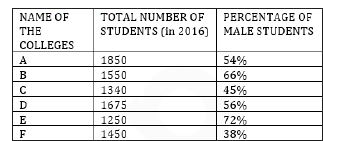
The number of female students in college C is what approx. percent of the number of male students of college A?
View SolutionStudy the following bar graph and answer the questions given below.
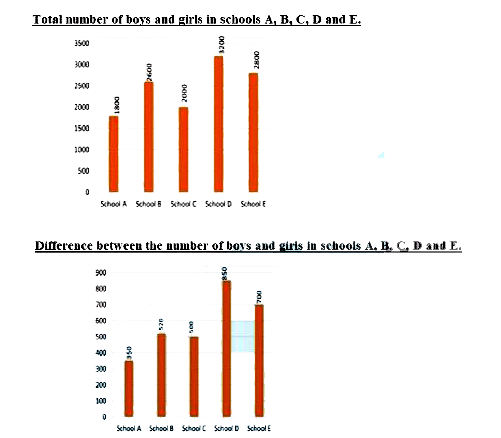
The number of boys in school B is what percentage of the total number of students in that school ?
View Solution
Knowledge Check
The data given in Bar diagram relate to the department wise admission of 320 students to B.Sc. (Honours) first year classes of a certain college in the given five subjetcs. Study the graph and answer the questions.
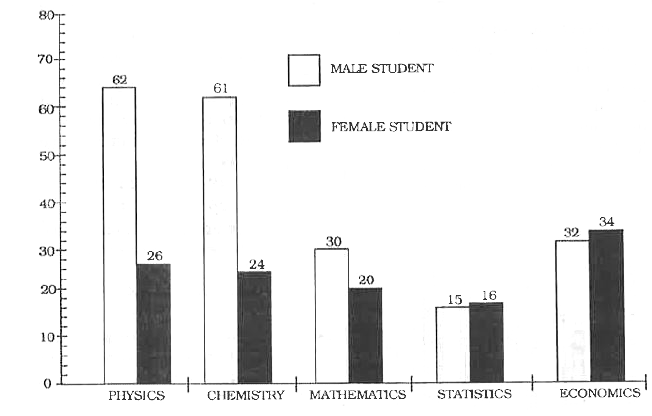
The subject which the female students are finding difficult as compared to other subjects is :AStatisticsBEconomcsCMathematicsDChemistryThe data given in Bar diagram relate to the department wise admission of 320 students to B.Sc. (Honours) first year classes of a certain college in the given five subjetcs. Study the graph and answer the questions.
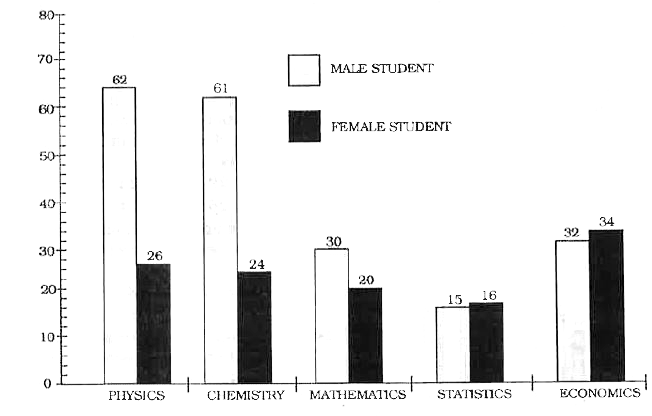
The subject in which the difference in the number of male and female students is minimum in :AEconomicsBPhysicsCStatisticsDChemis tryThe data given in Bar diagram relate to the department wise admission of 320 students to B.Sc. (Honours) first year classes of a certain college in the given five subjetcs. Study the graph and answer the questions.
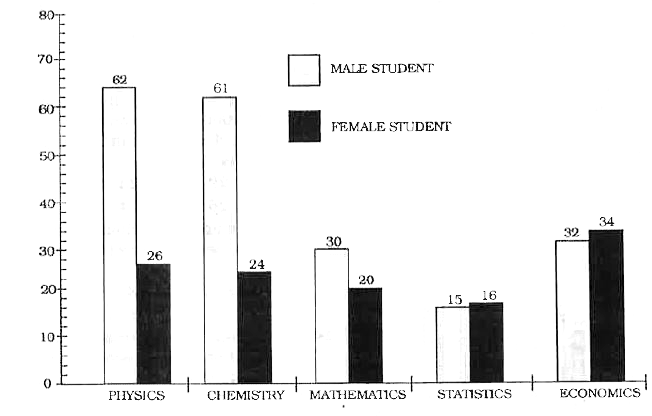
The diffrence of the choice of the subject between male and female students is maximum for the subject.APhysicsBSattisticsCEconomicsDChemistry
Study the following pie chart and table to answer the question
Total number of students admitted in a university in various fields=5000
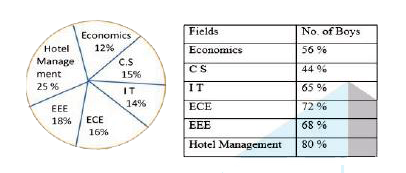
The ratio of the numbers of boys in Economics to the number of students in Economics is:
View Solution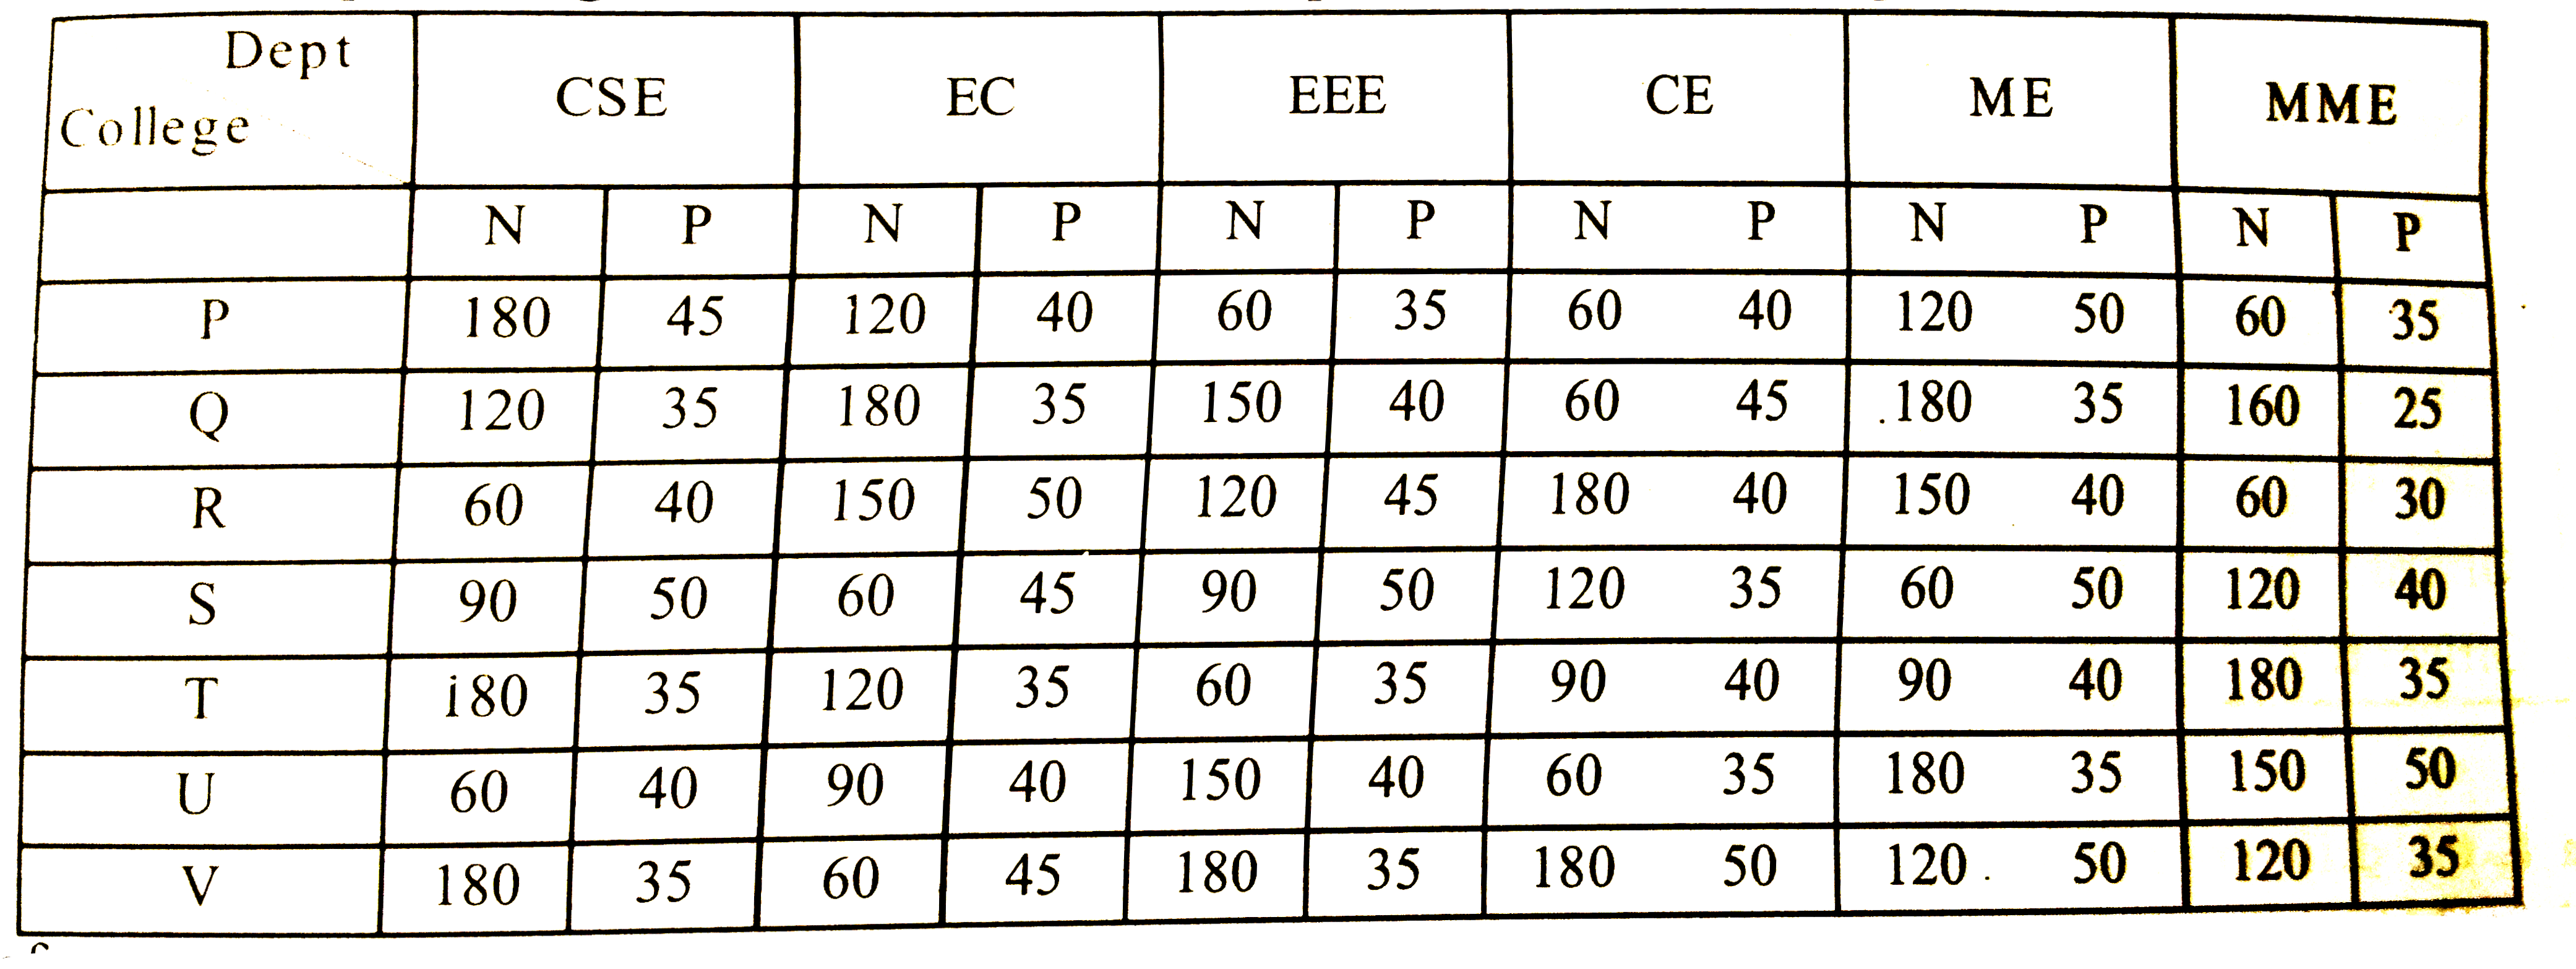
What is the total number of female students studing in the college R in the given six department together ?
View SolutionThe bar graph shows the number of students (in hundreds) admitted and passed out per year in a college during the years 2010 to 2014.
Study the bar graph and answer the question.
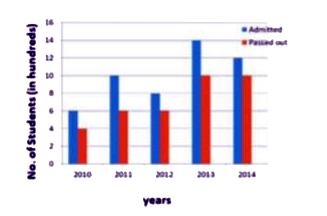
The ratio of the number of students admitted in the year 2012 to the average number of students passed out inthe years 2013 and 2014 is
View SolutionThe pie chart shows the number of students enrolled in the various engineering courses that a certain college offers. Studv the diagram and answer the following questions.
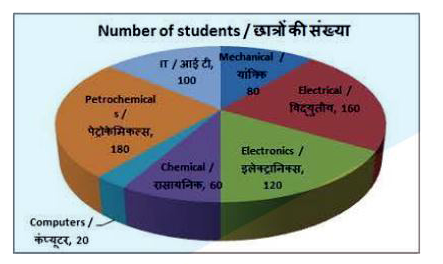
What is the total number of students enrolled in the college?
View SolutionStudy the following graph carefully to answer the questions that follow-----
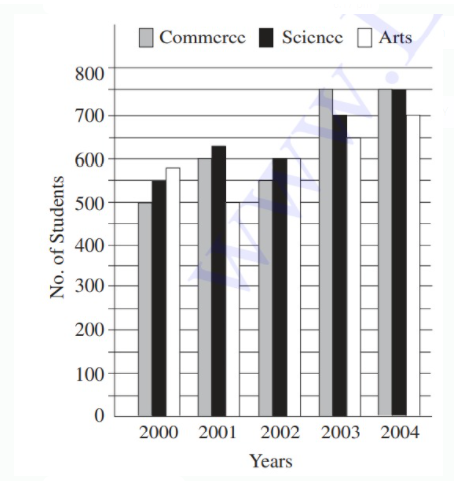
What is the total number of students studying Arts in all the years together ?
View Solution
