Study the following bar graph showing the percentage of children who can read at first grade level, grouped by their grade level in an Indian state.
For example, in 2008, 82% of the children from Standard 3 could read a text from Standard 1. Now answer the following question based on this graph.
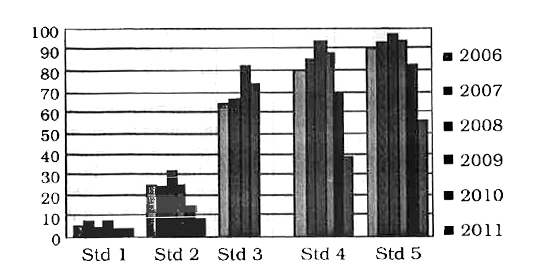
In the year 2010, what is the approximate value of average of all Std 1, 2, 3, 4, 5 children who could read the Std 1 text?
49.2%
57%
33%
Data insufficient
The correct Answer is:D
Step by step video, text & image solution for Study the following bar graph showing the percentage of children who can read at first grade level, grouped by their grade level in an Indian state. For example, in 2008, 82% of the children from Standard 3 could read a text from Standard 1. Now answer the following question based on this graph. In the year 2010, what is the approximate value of average of all Std 1, 2, 3, 4, 5 children who could read the Std 1 text? by Maths experts to help you in doubts & scoring excellent marks in Class 14 exams.
Topper's Solved these Questions
- BOOK - KIRAN PUBLICATIONCHAPTER - STATISTICS AND DATA INTERPRETATIONEXERCISE - TYPE-V38videos
STATISTICS AND DATA INTERPRETATION
- BOOK - KIRAN PUBLICATIONCHAPTER - STATISTICS AND DATA INTERPRETATIONEXERCISE - TYPE-VI86videos
STATISTICS AND DATA INTERPRETATION
- BOOK - KIRAN PUBLICATIONCHAPTER - STATISTICS AND DATA INTERPRETATIONEXERCISE - TYPE-III39videos
STATISTICS AND DATA INTERPRETATION
- BOOK - KIRAN PUBLICATIONCHAPTER - SIMPLIFICATIONEXERCISE - TEST YOURSELF25videos
SIMPLIFICATION
- BOOK - KIRAN PUBLICATIONCHAPTER - TIME AND DISTANCEEXERCISE - Type -XI74videos
TIME AND DISTANCE
Similar Questions
Knowledge Check
- Question 1 - Select One
Read the graph and answer the following questions.
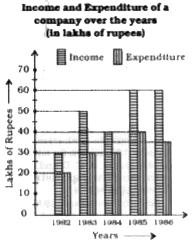
The ratio of the average income of all the years to the average profit isA24:13B48:17C12:7D6:5 - Question 2 - Select One
Observe the graph below and answer the following question.
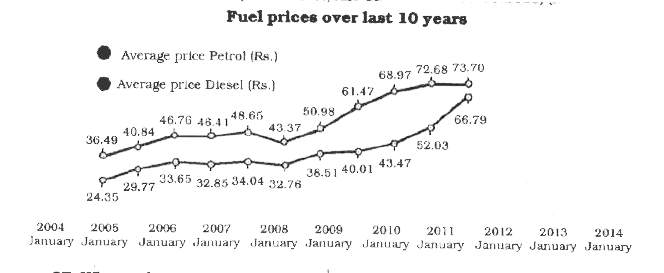
What is the approximate percentage difference in average price of petrol in 2004 and in 2014?A98%B100%C102%D105%
Read the graph and answer the following questions
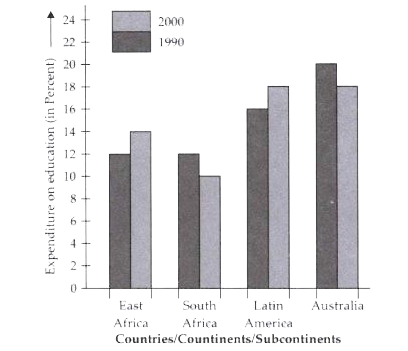
Give a suitable title to bar graphView SolutionRead the bar graph and answer the following questons.
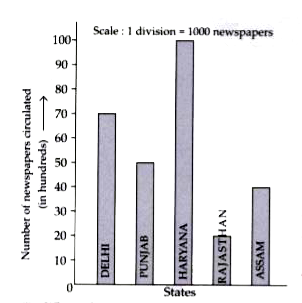
What information is given by graph ?View SolutionStudy the following graph and answer the question based on the graph.
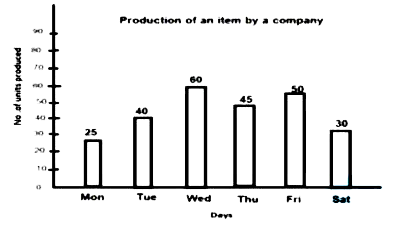
What was the percentage decline in the production from Friday to Saturday?View SolutionStudy the following graph and answer questions
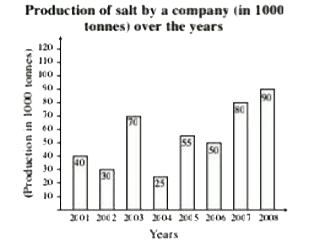
What was the percentage decline in the production of salt from 2003 to 2004 ?View SolutionThe following questions are based on the bar graph. Read the graph and answer the questions.
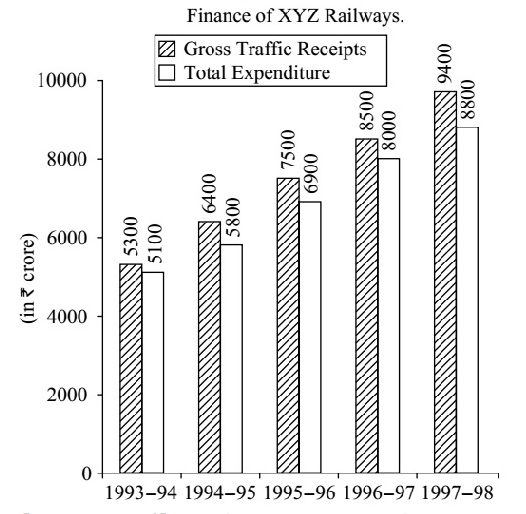
In which year was the profit as a percentage of gross traffic receipts highest?View SolutionStudy the following graph and answer the question based on the graph.
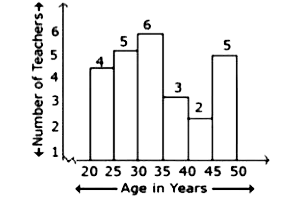
What percentage of the total number of teachers are aged less than 45 years?View Solution


