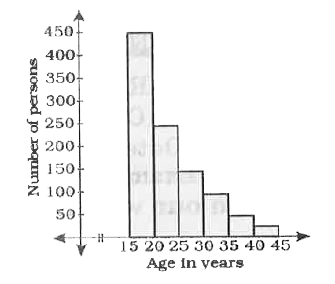
Study the following histogram and answer the questions.
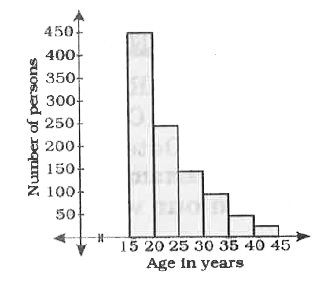
The ratio of the number of persons between the age group of 20 - 25 and 30 - 35 is :
1:3
2:1
10:3
5:2
The correct Answer is:C
Step by step video, text & image solution for Study the following histogram and answer the questions. The ratio of the number of persons between the age group of 20 - 25 and 30 - 35 is : by Maths experts to help you in doubts & scoring excellent marks in Class 14 exams.
Topper's Solved these Questions
- BOOK - KIRAN PUBLICATIONCHAPTER - STATISTICS AND DATA INTERPRETATIONEXERCISE - TYPE-VI86videos
STATISTICS AND DATA INTERPRETATION
- BOOK - KIRAN PUBLICATIONCHAPTER - STATISTICS AND DATA INTERPRETATIONEXERCISE - TYPE-VII363videos
STATISTICS AND DATA INTERPRETATION
- BOOK - KIRAN PUBLICATIONCHAPTER - STATISTICS AND DATA INTERPRETATIONEXERCISE - TYPE-IV182videos
STATISTICS AND DATA INTERPRETATION
- BOOK - KIRAN PUBLICATIONCHAPTER - SIMPLIFICATIONEXERCISE - TEST YOURSELF25videos
SIMPLIFICATION
- BOOK - KIRAN PUBLICATIONCHAPTER - TIME AND DISTANCEEXERCISE - Type -XI74videos
TIME AND DISTANCE
Similar Questions
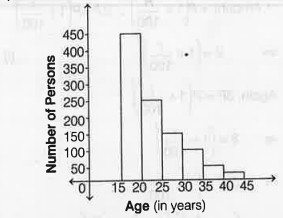
Direction :- Study the histogram and answer the following questions
 .
.
The ratio of the number of persons between the age group of 20-25 and 30-35 is
(A) 1:3
(B) 2:1
(C ) 10:3
(D) 6:1View SolutionA study was made for the number of persons of different age group visited in a library in a week which is shown in the histogram. Study the histogram and answer the question given below.
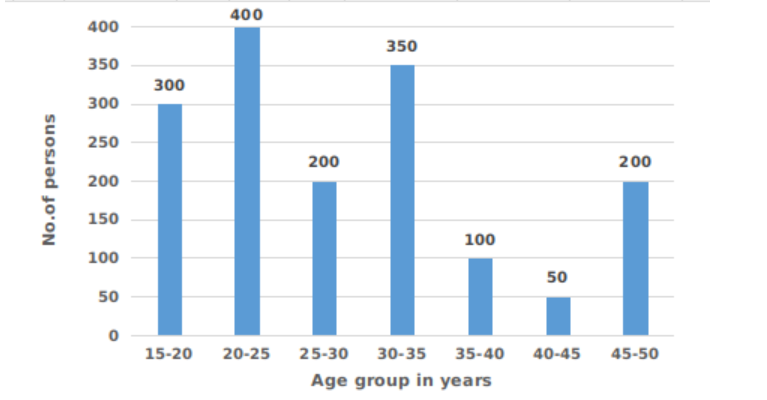
The ratio of the number of persons in the age groups 15-20 years and 20-25 years together, to the number of persons in the age groups 30-35 years and 35-40 years together, is:View Solution
Knowledge Check
- Question 1 - Select One
Study the following histogram and answer the questions.
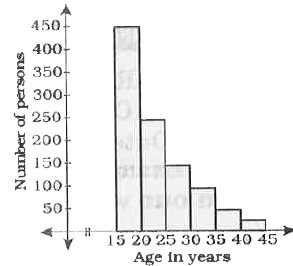
The total number of persons in the age group of 15 years to 45 years is :A450B800C1000D500 - Question 2 - Select One
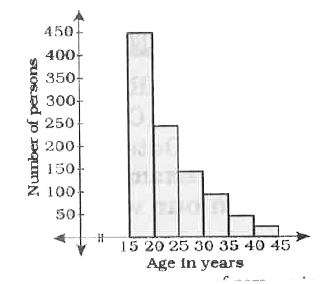
Study the following histogram and answer the questions.
The number of persons in the age group 20 - 30 years is :A475B400C300D700 - Question 3 - Select One
Study the following histogram and answer the questions.
The percentage of population under study which is in the age group of 40 - 45 is :A2.5%B3.5%C1.5%D5%
Study the following histogram and answer the given question.
A study was made for the number of persons of different age group visited in a library in a week which is shown in given in the histogram. Study the histogram and answer the question given below.
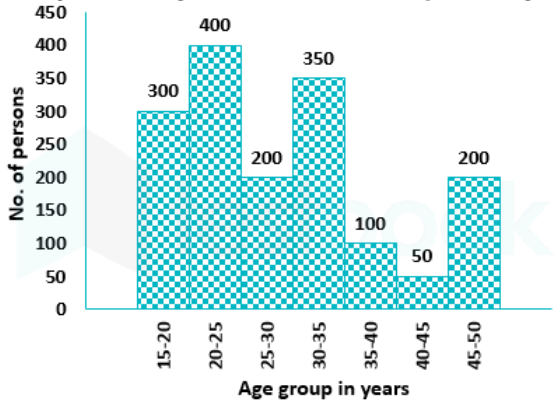
What percent of the total number of persons visiting library in the week was the number of persons of age group 25-30 years?View SolutionStudy the following histogram and answer the given question.
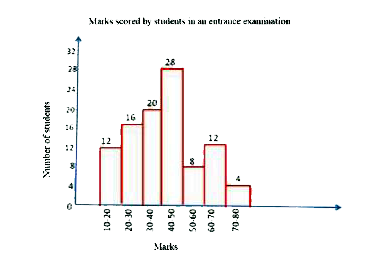
What is the ratio of the number of students who scored 30 or more marks, but below 40 marks, to the total number of students in the entrance examination?View SolutionStudy the following Histogram and answer the following questions.
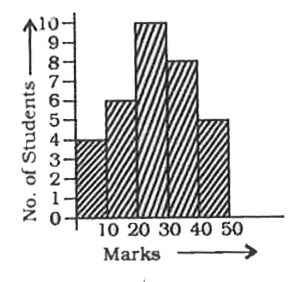
The total number of students involved in the data isView SolutionStudy the following Histogram and answer the following questions.
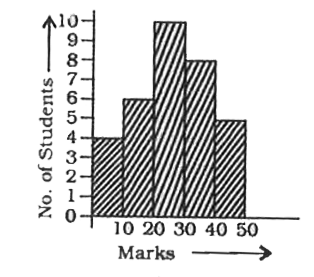
The least number of students got the marks in the intervalView SolutionStudy the following histogram and answer the questions.
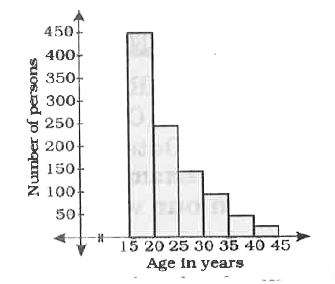
The ratio of maximum population in an age group to the total number of persons under study is :View Solution

