In each of the following questions, the following histogram shows the relationship between the marks obtained by the students and the number of students in an examination. Study the histogram and answer the questions.
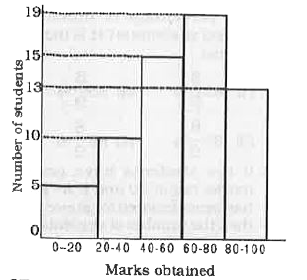
The percentage of students who obtained 40 markks or less is
25
less than 25, but not 15
more than 24
15
The correct Answer is:C
Step by step video, text & image solution for In each of the following questions, the following histogram shows the relationship between the marks obtained by the students and the number of students in an examination. Study the histogram and answer the questions. The percentage of students who obtained 40 markks or less is by Maths experts to help you in doubts & scoring excellent marks in Class 14 exams.
Updated on:21/07/2023Topper's Solved these Questions
- STATISTICS AND DATA INTERPRETATIONBOOK - KIRAN PUBLICATIONCHAPTER - STATISTICS AND DATA INTERPRETATIONEXERCISE - TYPE-VI
86 Videos
- STATISTICS AND DATA INTERPRETATIONBOOK - KIRAN PUBLICATIONCHAPTER - STATISTICS AND DATA INTERPRETATIONEXERCISE - TYPE-VII
363 Videos
- STATISTICS AND DATA INTERPRETATIONBOOK - KIRAN PUBLICATIONCHAPTER - STATISTICS AND DATA INTERPRETATIONEXERCISE - TYPE-IV
182 Videos
- SIMPLIFICATIONBOOK - KIRAN PUBLICATIONCHAPTER - SIMPLIFICATIONEXERCISE - TEST YOURSELF
25 Videos
- TIME AND DISTANCEBOOK - KIRAN PUBLICATIONCHAPTER - TIME AND DISTANCEEXERCISE - Type -XI
74 Videos
Similar Questions
Study the given histogram that shows the marks obtained by students in examination and answer the question that follows
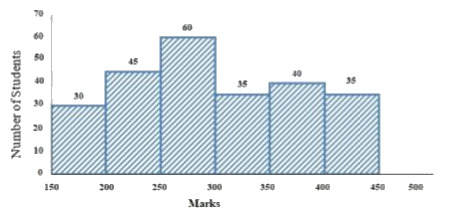
The number of students who obtained less than 200 marks is :
View SolutionStudy the following Histogram and answer the following questions.
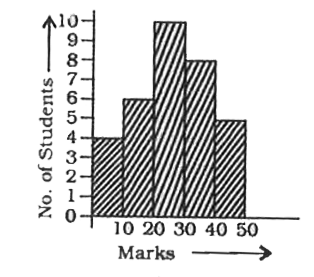
The least number of students got the marks in the interval
View Solution
Knowledge Check
In each of the following questions, the following histogram shows the relationship between the marks obtained by the students and the number of students in an examination. Study the histogram and answer the questions.
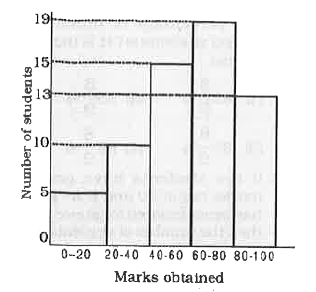
The ratio of the number of students who obtained 60 or more marks to that of students who obtained 60 or less marks isA15:16B15:19C14:17D16:15Study the given histogram that shows the marks obtained by students in an examination and answer the question that follows .
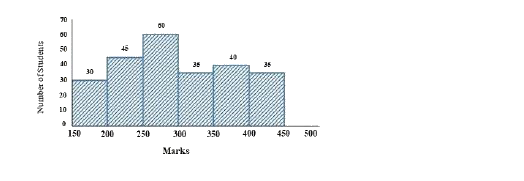
The number of students who obtained less than 250 marks is :A135B75C30D45Study the given graph and answer the question that follows .
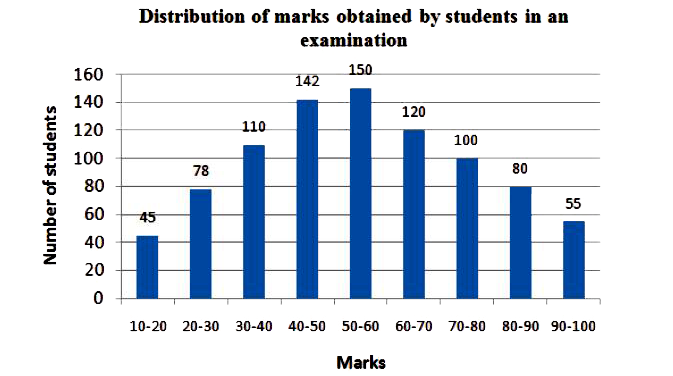
The number of students who obtained 20 marks or more but less than 60 marks is :A402B600C480D522
The histogram shows the marks obtained by 45 students of a class. Look at the histogram and answer the questions.
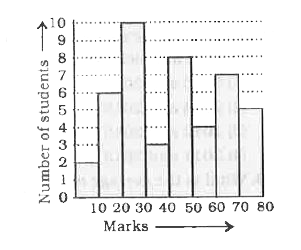
How many students have obtained marks less than 10 ?
View SolutionStudy the following Histogram and answer the following questions.
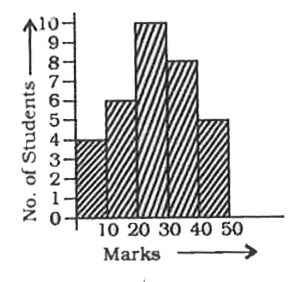
The total number of students involved in the data is
View SolutionThe following histogram shows the distribution of marks of 50 students in a collegeThe average marks of the students, number is
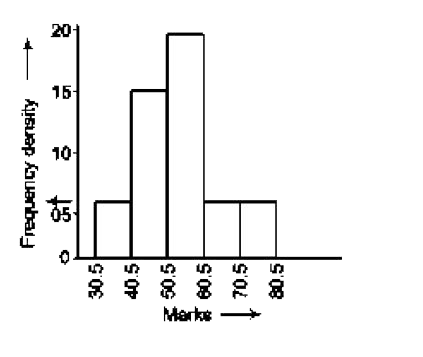
View SolutionThe histogram shows the maeks obtained by 45 students of a class. Look at the histogram and answer the questions.
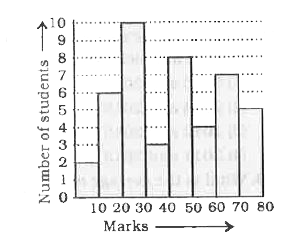
How many students have obtained marks 50 and above ?
View SolutionThe histogram shows the marks obtained by 45 students of a class. Look at the histogram and answer the questions.
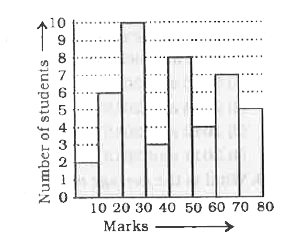
How many students have obtained 30 or more marks but less than 40 ?
View Solution
