The diagram shows the age-distribution of the patients admitted to a hospital on a particular day. Study the diagram and particularly day. Study the diagram and answer the questions.
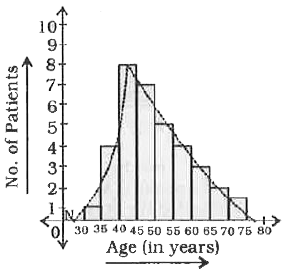
Percentage of patients of age less than 45 years, who got admitted to the hospital on that day is approximately equal to
14%
20%
37%
62%
The correct Answer is:C
Step by step video, text & image solution for The diagram shows the age-distribution of the patients admitted to a hospital on a particular day. Study the diagram and particularly day. Study the diagram and answer the questions. Percentage of patients of age less than 45 years, who got admitted to the hospital on that day is approximately equal to by Maths experts to help you in doubts & scoring excellent marks in Class 14 exams.
Topper's Solved these Questions
- BOOK - KIRAN PUBLICATIONCHAPTER - STATISTICS AND DATA INTERPRETATIONEXERCISE - TYPE-VI86videos
STATISTICS AND DATA INTERPRETATION
- BOOK - KIRAN PUBLICATIONCHAPTER - STATISTICS AND DATA INTERPRETATIONEXERCISE - TYPE-VII363videos
STATISTICS AND DATA INTERPRETATION
- BOOK - KIRAN PUBLICATIONCHAPTER - STATISTICS AND DATA INTERPRETATIONEXERCISE - TYPE-IV182videos
STATISTICS AND DATA INTERPRETATION
- BOOK - KIRAN PUBLICATIONCHAPTER - SIMPLIFICATIONEXERCISE - TEST YOURSELF25videos
SIMPLIFICATION
- BOOK - KIRAN PUBLICATIONCHAPTER - TIME AND DISTANCEEXERCISE - Type -XI74videos
TIME AND DISTANCE
Similar Questions
Direction: In the graph, number of patients admitted in a hospital as per age, in a day, is given. Study the graph carefully and answer the questions.
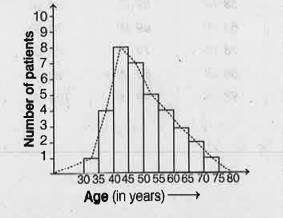
Find total number of pateintsView SolutionDirection: In the graph, number of patients admitted in a hospital as per age, in a day, is given. Study the graph carefully and answer the questions.
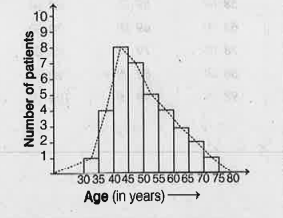
Find total number of patients between 55 yr to 60 yr, admitted in hospital in a day.View Solution
Knowledge Check
- Question 1 - Select One
The diagram shows the age-distribution of the patients admitted to a hospital on a particular day. Study the diagram and particularly day. Study the diagram and answer the questions.
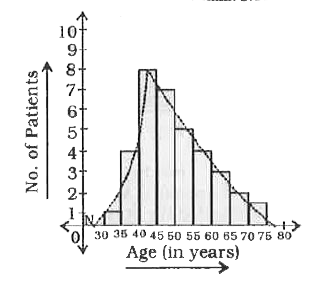
Total number of patients of age more than 55 years, who got admitted to the hospital isA4B7C9D10 - Question 2 - Select One
The diagram shows the age-distribution of the patients admitted to a hospital on a particular day. Study the diagram and particularly day. Study the diagram and answer the questions.
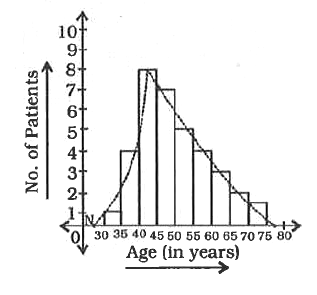
Number of patients of age between 55 years to 60 years, who got admitted to the hospital on that day isA6B4C24D8 - Question 3 - Select One
The diagram shows the age-distribution of the patients admitted to a hospital on a particular day. Study the diagram and particularly day. Study the diagram and answer the questions.
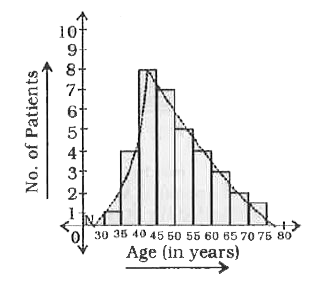
Number of patients of age more than 40 years and less than 55 years, who got admitted to the hospital on that day isA20B30C15D12
The following table shows ages of 300 patients getting medical treatment in a hospital on a particular day:
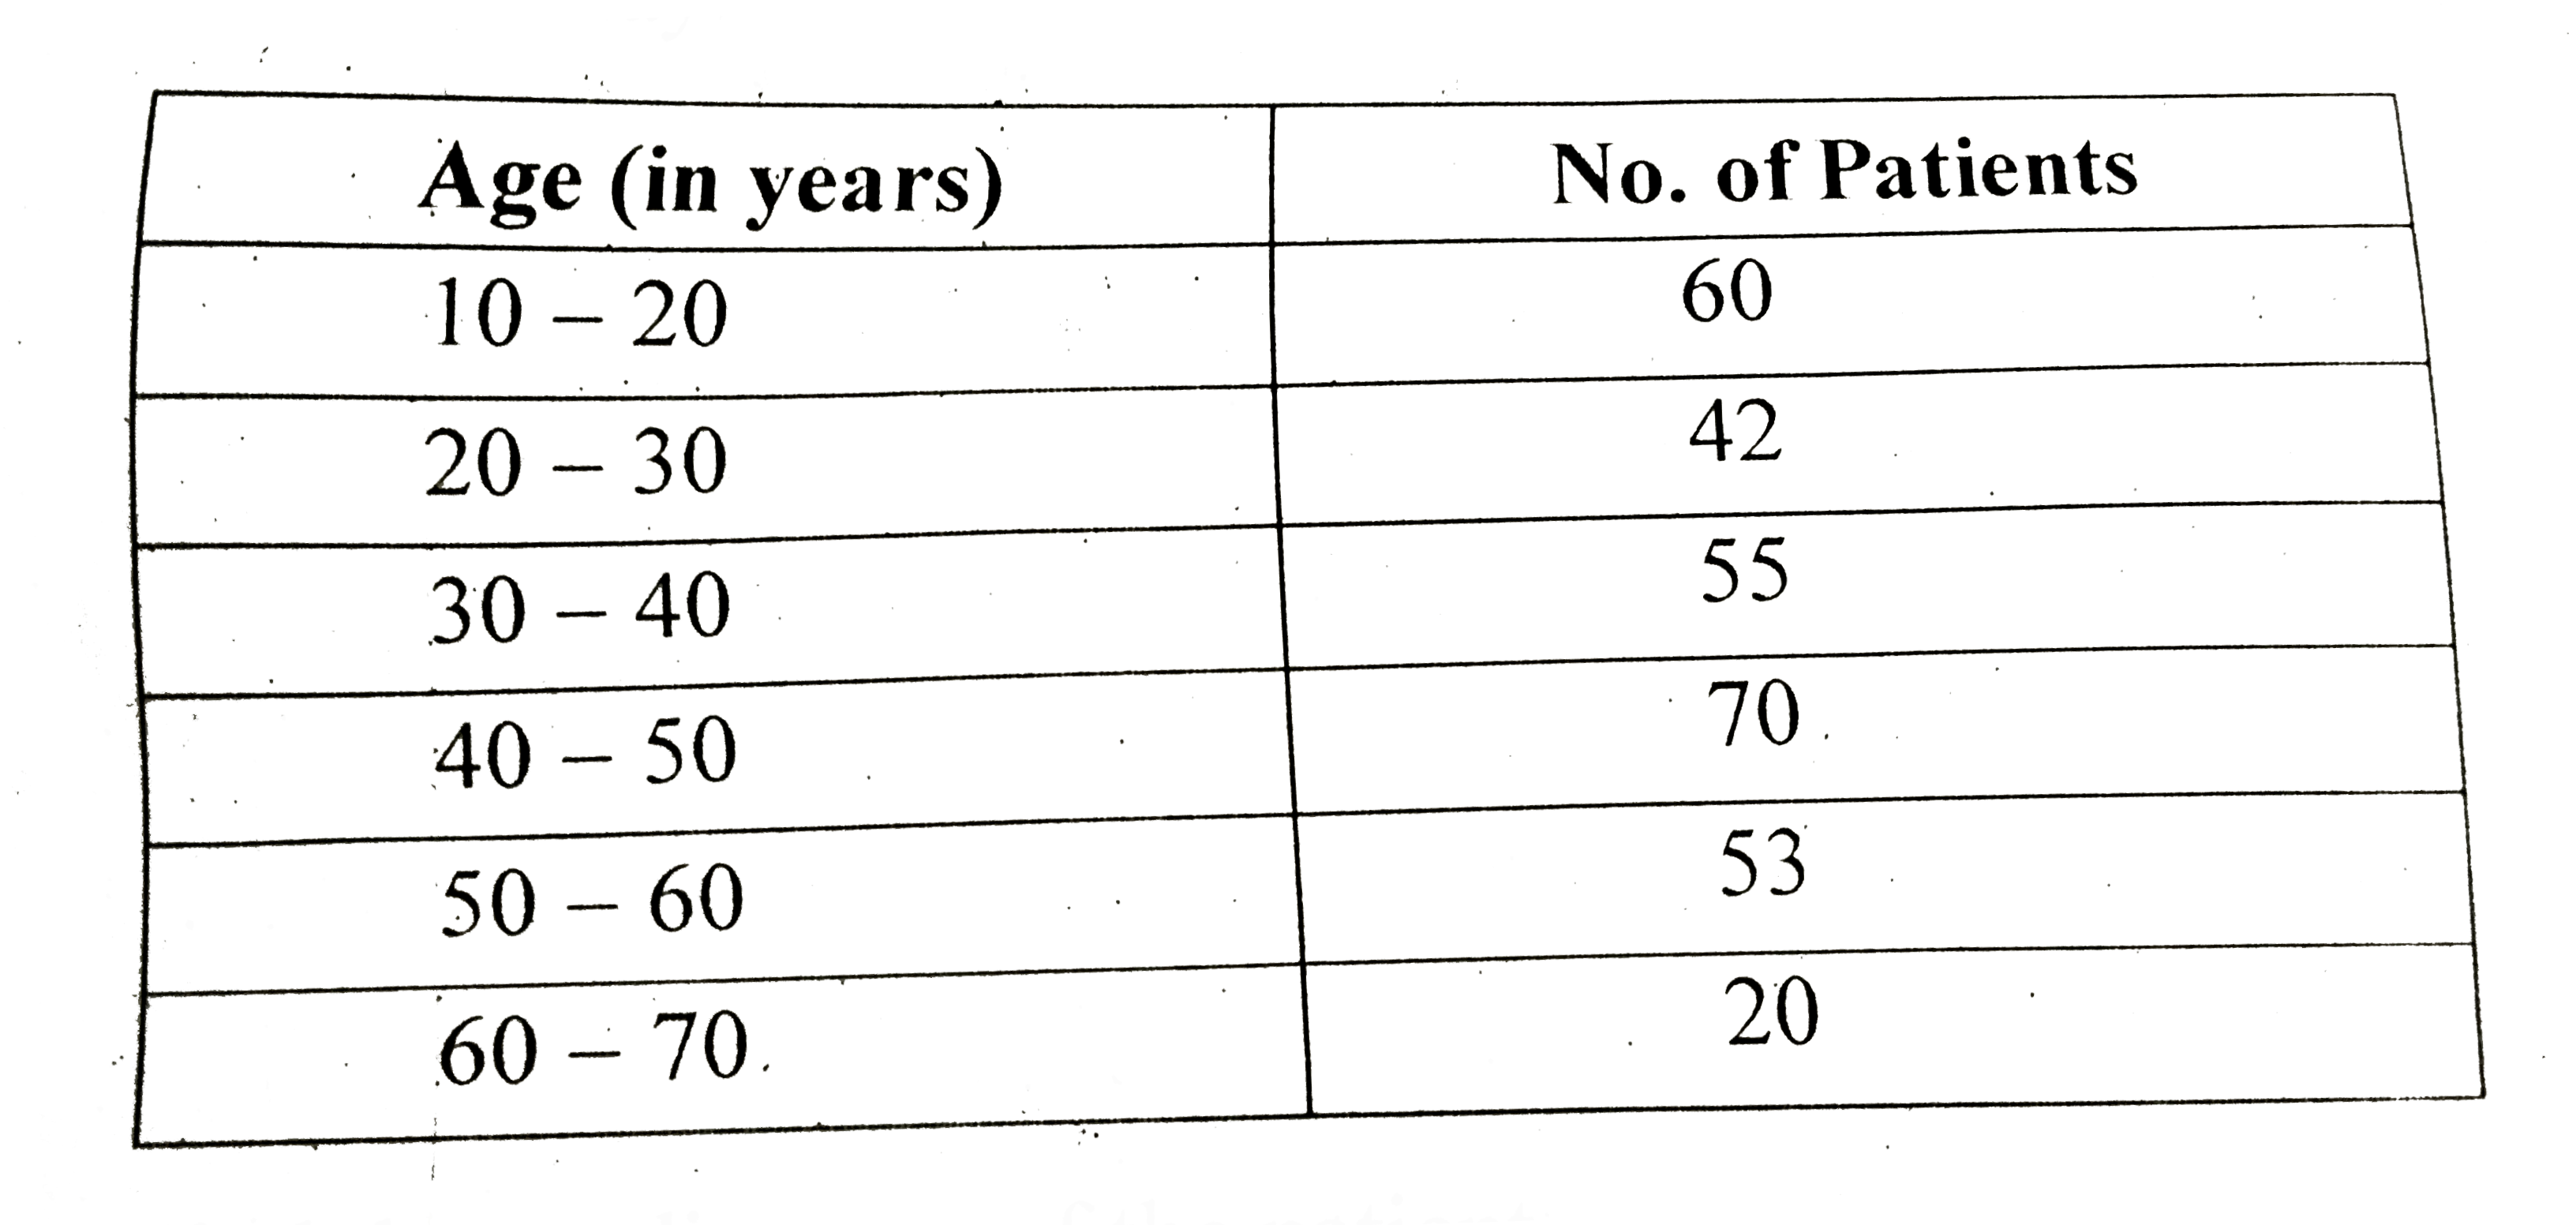
Find the median age of the patient.View SolutionThe diagram shows the age-distribution of the patients admitted to a hospital on a particular day. Study the diagram and particularly day. Study the diagram and answer the questions.

Total number of patients of age more than 55 years, who got admitted to the hospital isView SolutionStudy the bar diagram and answer the questions.
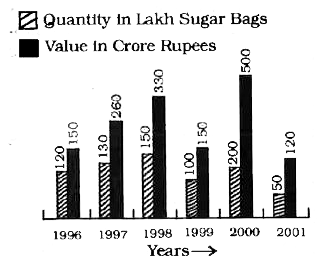
The approximate percentage incresase in value from 1997 to 1998 wasView SolutionThe pie chart shows the distribution of wealth among 7 children according to their father's will. Study the diagram and answer the following questions.
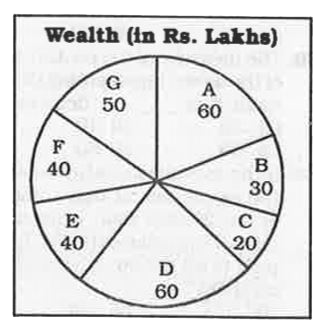
Which child got the least share of wealth according to the will?View SolutionThe given histogram shows the frequency distribution of the speed of cars passing though at a particular spot on a highway. Study the graph and answer the question that follows.
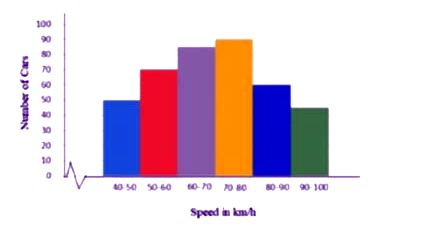
What percentage of cars were running with speed less than 70 km/h?View Solution

