The graph given here shows a car following the linear path with uniform speed. Study the graph and answer the questions.
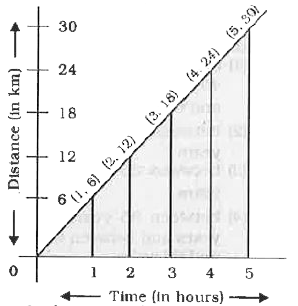
The distance travelled by the car in 4.5 hours is
27 km
30 km
36 km
40 km
The correct Answer is:A
Step by step video, text & image solution for The graph given here shows a car following the linear path with uniform speed. Study the graph and answer the questions. The distance travelled by the car in 4.5 hours is by Maths experts to help you in doubts & scoring excellent marks in Class 14 exams.
Topper's Solved these Questions
- BOOK - KIRAN PUBLICATIONCHAPTER - STATISTICS AND DATA INTERPRETATIONEXERCISE - TYPE-VII363videos
STATISTICS AND DATA INTERPRETATION
- BOOK - KIRAN PUBLICATIONCHAPTER - STATISTICS AND DATA INTERPRETATIONEXERCISE - TYPE-VIII8videos
STATISTICS AND DATA INTERPRETATION
- BOOK - KIRAN PUBLICATIONCHAPTER - STATISTICS AND DATA INTERPRETATIONEXERCISE - TYPE-V38videos
STATISTICS AND DATA INTERPRETATION
- BOOK - KIRAN PUBLICATIONCHAPTER - SIMPLIFICATIONEXERCISE - TEST YOURSELF25videos
SIMPLIFICATION
- BOOK - KIRAN PUBLICATIONCHAPTER - TIME AND DISTANCEEXERCISE - Type -XI74videos
TIME AND DISTANCE
Similar Questions
The speed-time graph for a car is shown is Figure
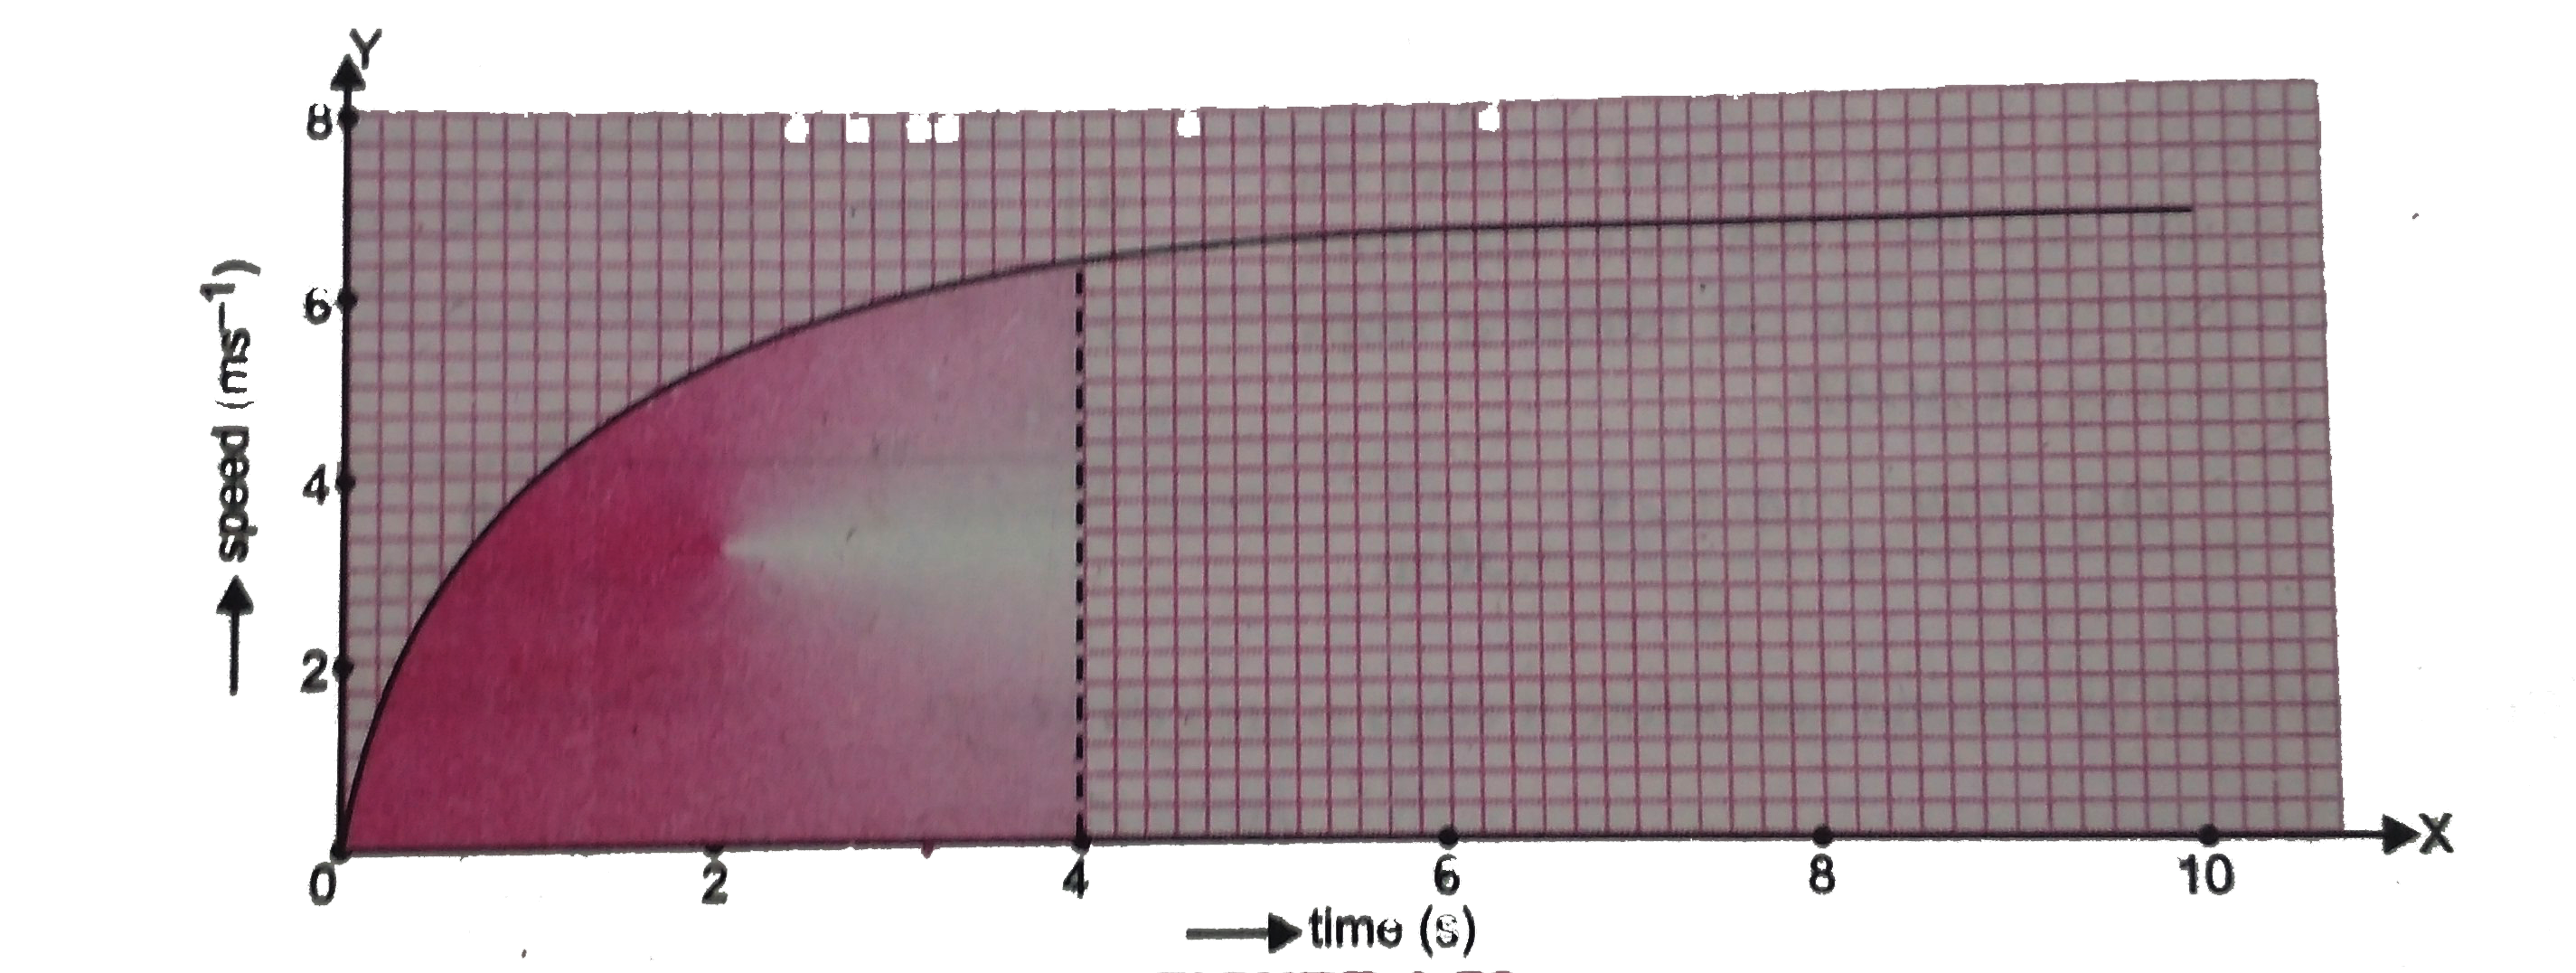
(a) Find how far does the car travel in the first 4 seconds. Shade the area on the graph that represents the distance travelled by the car during this period.
(b) Which part of the graph represents uniform motion of the car ?View SolutionThe following graph shows the sales of cars (in thousands) in four cities in 4 years. Study the graph and answer the question.
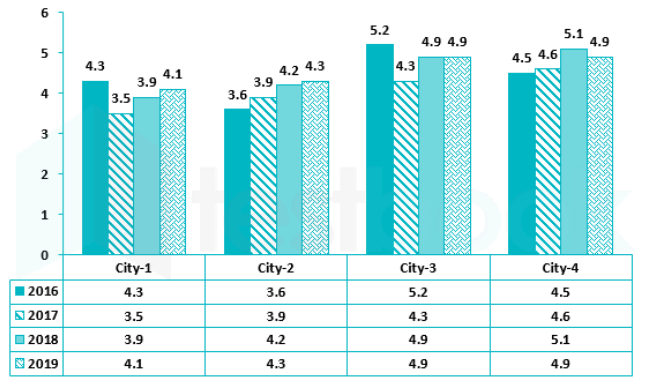
In 2019, what is the average number of sales among all four cities?View Solution
Knowledge Check
- Question 1 - Select One
The graph given here shows a car following the linear path with uniform speed. Study the graph and answer the questions.
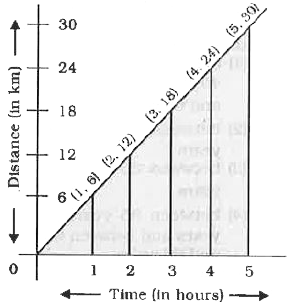
The speed of the car isA12 km/hrB6 km/hrC18 km/hrD24 km/hr - Question 2 - Select One
The graph given here shows a car following the linear path with uniform speed. Study the graph and answer the questions.
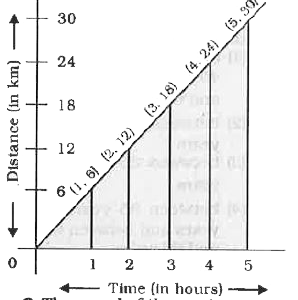
The speed of the car (in metres per minute) isA60B100C600D1000 - Question 3 - Select One
The graph given here shows a car following the linear path with uniform speed. Study the graph and answer the questions.
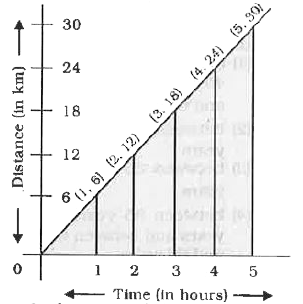
The car covers a distance of 15 kilometres inA3 hoursB2 hoursC1.5 hoursD2.5 hours
The speed-time graph for a car is shown is Figure

(a) Find how far does the car travel in the first 4 seconds. Shade the area on the graph that represents the distance travelled by the car during this period.
(b) Which part of the graph represents uniform motion of the car ?View SolutionThe following graph shows the sales of cars (in thousands) in four cities in 4 years. Study the graph and answer the question.
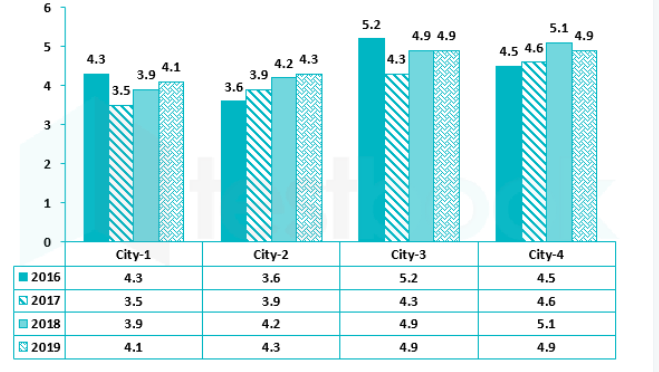
Which city has the highest sales?View SolutionStudy the graph carefully and answer the following questions.
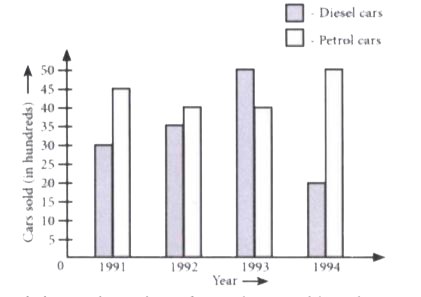
Find the mean sale of Petrol cars.View SolutionThe given bar graph shows the biscuit exports of India over a period of five years. Study the graph and answer the questions that follows
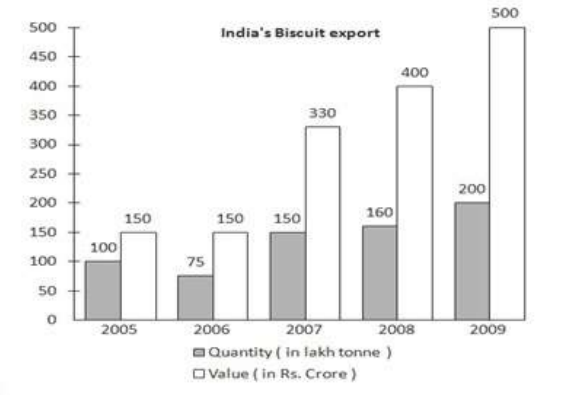
In which two year was the value per tonne equal?View SolutionThe following graph represents the transport used by children. Study the graph and answer the given questions.
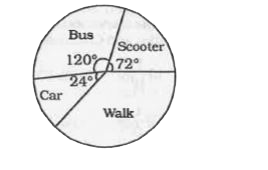
If 10 students come by car, how many come by bus ?View Solution
