Following is the pie-chart showing the spendings of a family on various items in a particular year
Study the pie chart and answer questions.
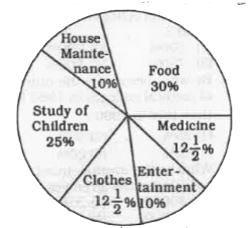
If the difference in the amount spent for buying clothes and house maintenance was Rs 1,500, how much they spent for house maintenance ?
Rs 5,000
Rs 6,000
Rs 7,000
Rs 8,000
The correct Answer is:B
Step by step video & image solution for Following is the pie-chart showing the spendings of a family on various items in a particular year Study the pie chart and answer questions. If the difference in the amount spent for buying clothes and house maintenance was Rs 1,500, how much they spent for house maintenance ? by Maths experts to help you in doubts & scoring excellent marks in Class 14 exams.
Updated on:21/07/2023Topper's Solved these Questions
- STATISTICS AND DATA INTERPRETATIONBOOK - KIRAN PUBLICATIONCHAPTER - STATISTICS AND DATA INTERPRETATIONEXERCISE - TYPE-VIII
8 Videos
- STATISTICS AND DATA INTERPRETATIONBOOK - KIRAN PUBLICATIONCHAPTER - STATISTICS AND DATA INTERPRETATIONEXERCISE - TYPE-VI
86 Videos
- SIMPLIFICATIONBOOK - KIRAN PUBLICATIONCHAPTER - SIMPLIFICATIONEXERCISE - TEST YOURSELF
25 Videos
- TIME AND DISTANCEBOOK - KIRAN PUBLICATIONCHAPTER - TIME AND DISTANCEEXERCISE - Type -XI
74 Videos
Similar Questions
Following is the pie-chart showing the spendings of a family on various items in a particular year
Study the pie chart and answer questions.
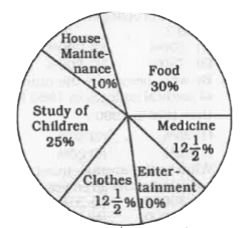
The ratio of the total amount spent for food and medicine is
View SolutionFollowing is the pie-chart showing the spendings of a family on various items in a particular year
Study the pie chart and answer questions.
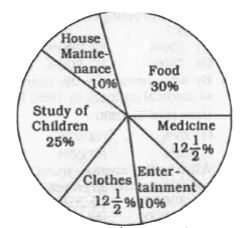
Angle of the pie chart representing the expenditure on entertainment is
View Solution
Knowledge Check
The pie chart drawn below shows the spendings of a country on various sports during a particular year. Study the pie chart and answer the questions.
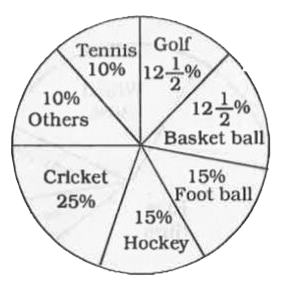
If, the total amount spent on sports during the year was Rs. 1,20,00,000, how much was spent on basketball ?ARs. 950000BRs. 10,00,000CRs. 12,00,000DRs. 15,00,000The pie chart drawn below shows the spendings of a country on various sports during a particular year. Study the pie chart and answer the questions.
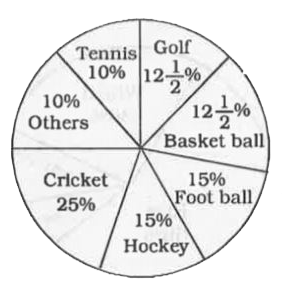
If the money spent on cricket during the year was Rs. 20,00,000, then the money spent on tennis was :ARs. 8,00,000BRs. 10,00,000CRs. 80,00,000DRs. 40,00,000The pie chart drawn below shows the spendings of a country on various sports during a particular year. Study the pie chart and answer the questions.
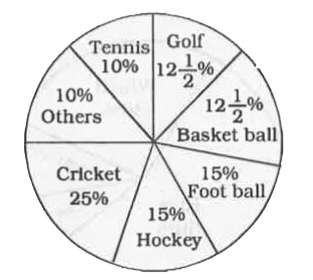
The ratio of the amount spent on football, basketball and cricket to that spent on tennis, hockey and golf isA5:7B7:5C15:1D3:20
Following is the pie-chart showing the spendings of a family on various items in a particular year
Study the pie chart and answer questions.
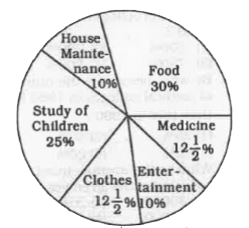
If the total amount spent on the family during the year was Rs 35,000, the amount spent for study of children and food together was
View SolutionDirection :- Following is the pie-chart showing the spendings of a family on various items in a particular year Study the pie chart and answer questions.
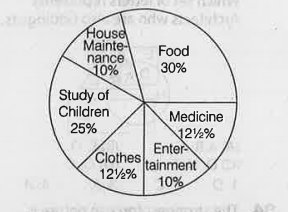 If the total amount spet on the family during the year was Rs. 35000, then the amount spent for stud of children and food together was (A) Rs. 19250 (B) Rs. 19500 (C) Rs.19750 (D) Rs. 19850
View SolutionThe pie chart,drawn, shows the spending of a country on various sports during a particular year. Study the graph carefully and answer the questions that follow.
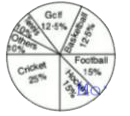
Out of the following the country spent the same amount on
View SolutionThe Pie Charts shows the expenditure of a country on various sports during a particular year. Study the graph and answer the questions:
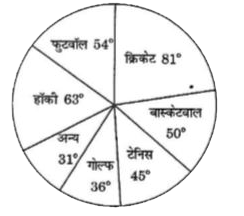
How much per cent more is spent on Hockey than that on Golf ?
View SolutionThe pie chart drawn below shows the spendings of a country on various sports during a particular year. Study the pie chart and answer the questions.
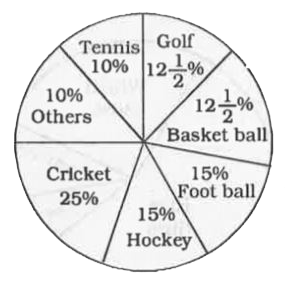
Total central angle showing the money spent on hockey, football and other during the year was
View Solution
