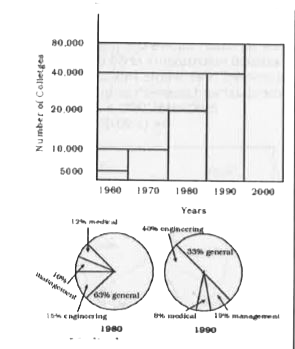
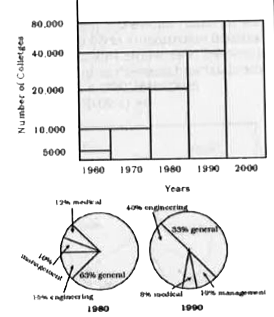
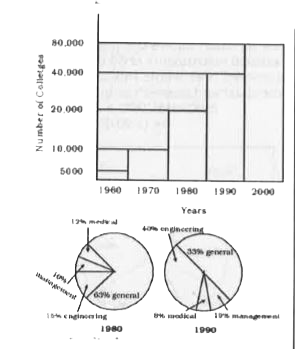
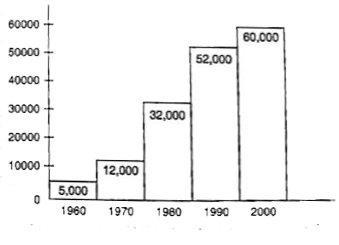
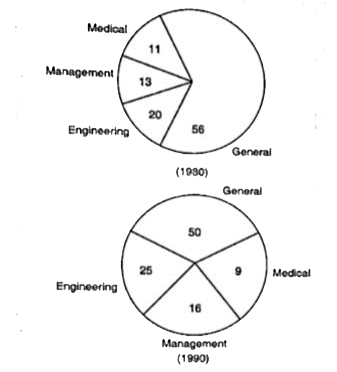
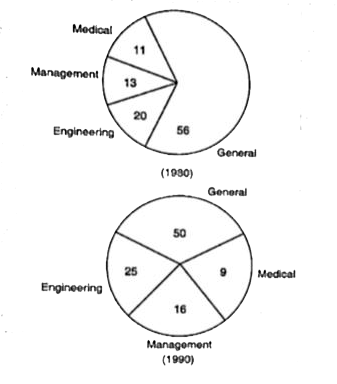
The numbers of different colleges in India in different years is given in the graph below. Percent distribution of different colleges in year 1980 and 1990 is shown in pie chart
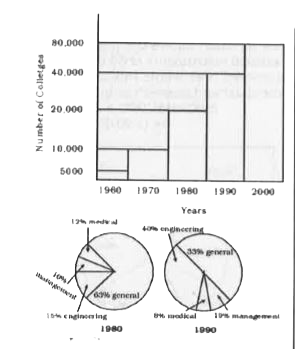
The difference in number of management colleges in 1980 to 1990 is :
3600
3000
5600
1500
The correct Answer is:C
Topper's Solved these Questions
- STATISTICS AND DATA INTERPRETATIONBOOK - KIRAN PUBLICATIONCHAPTER - STATISTICS AND DATA INTERPRETATIONEXERCISE - TYPE-VIII
8 Videos
- STATISTICS AND DATA INTERPRETATIONBOOK - KIRAN PUBLICATIONCHAPTER - STATISTICS AND DATA INTERPRETATIONEXERCISE - TYPE-VI
86 Videos
- SIMPLIFICATIONBOOK - KIRAN PUBLICATIONCHAPTER - SIMPLIFICATIONEXERCISE - TEST YOURSELF
25 Videos
- TIME AND DISTANCEBOOK - KIRAN PUBLICATIONCHAPTER - TIME AND DISTANCEEXERCISE - Type -XI
74 Videos
Similar Questions
Numbers of different colleges in India in different years is given in the graph below. Percent distribution of different colleges in year 1980 and 1990 is show in pie chart
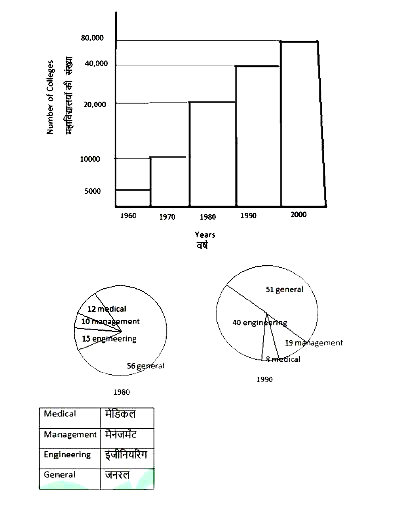
What is the difference in number of engineering colleges in 80's and 90's.
View SolutionNumbers of different colleges in India in different years is given in the graph below. Percent distribution of different colleges in year 1980 and 1990 is show in pie chart
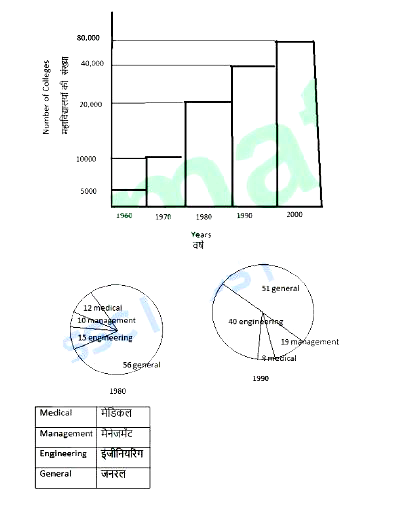
What is the % increment in the number of colleges from 1960 to 1980?
View Solution
Knowledge Check
The numbers of different colleges in India in different years is given in the graph below. Percent distribution of different colleges in year 1980 and 1990 is shown in pie chart
What is the difference in number of engineering colleges in 80∘sand90∘s.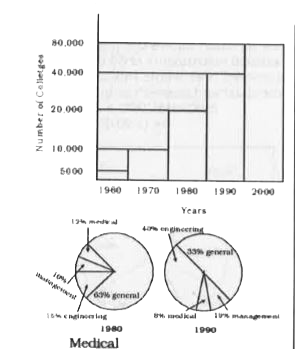
A13000B10000C15000DNone of theseThe numbers of different colleges in India in different years is given in the graph below. Percent distribution of different colleges in year 1980 and 1990 is shown in pie chart
What is the % increament in the number of colleges from 1960 to 1980 ?A300%B700%C750%D800%The numbers of different colleges in India in different years is given in the graph below. Percent distribution of different colleges in year 1980 and 1990 is shown in pie chart
By what percent is the number of medical colleges in 1980 less than that in 1990 ?A25%B30%C32%D20%
Numbers of different colleges in India in different years is given in the graph below. Percent distribution of different colleges in year 1980 and 1990 is show in pie chart
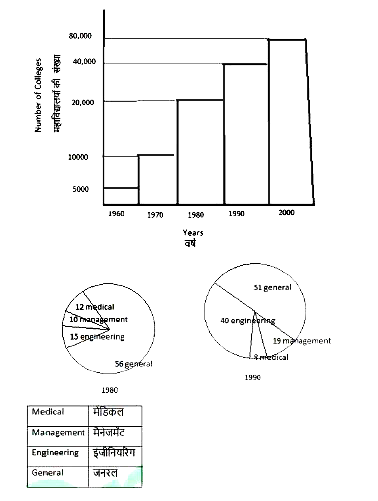
Determine the increment % of number of medical colleges in 1960 to 2000
View SolutionNumbers of different colleges in India in different years is given in the graph below. Percent distribution of different colleges in year 1980 and 1990 is show in pie chart
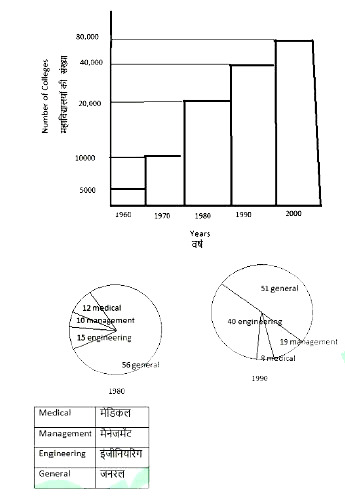
If the projected increase in the number of colleges in 2000 over 1990 is to be same in all categories of colleges, the % of engineering college in 2000 will be?
View SolutionThe numbers of different colleges in India in different years is given in the graph below. Percent distribution of different colleges in year 1980 and 1990 is shown in pie chart
What id the average number of collges for the given years ?
View SolutionNumber of different colleges in India in different years is given in the graph below. Distribution of different colleges in the years 1980 and 1990 shown in the pie charts below :
The growth rate in no. of medical colleges in 1980 to 1990 is :
View SolutionNumber of different colleges in India in different years is given in the graph below. Distribution of different colleges in the years 1980 and 1990 shown in the pie charts below :
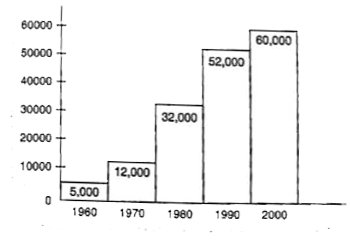
if the projected increase in the number of colleges in 2000 over 1990 is to be the same in all the categories of colleges, the percentage of medical colleges in 2000 will be :
View Solution
