The Pie-chart shows the result of a survey among 119060 people concerning the use of tobacco. Study the Pie-chart and answer the questions.
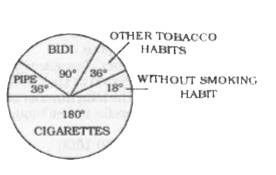
The number of Cigarette smoking people is greater than the number of Pipe smoking people by :
29765
47624
11906
59530
The correct Answer is:B
Step by step video & image solution for The Pie-chart shows the result of a survey among 119060 people concerning the use of tobacco. Study the Pie-chart and answer the questions. The number of Cigarette smoking people is greater than the number of Pipe smoking people by : by Maths experts to help you in doubts & scoring excellent marks in Class 14 exams.
Updated on:21/07/2023Topper's Solved these Questions
- STATISTICS AND DATA INTERPRETATIONBOOK - KIRAN PUBLICATIONCHAPTER - STATISTICS AND DATA INTERPRETATIONEXERCISE - TYPE-VIII
8 Videos
- STATISTICS AND DATA INTERPRETATIONBOOK - KIRAN PUBLICATIONCHAPTER - STATISTICS AND DATA INTERPRETATIONEXERCISE - TYPE-VI
86 Videos
- SIMPLIFICATIONBOOK - KIRAN PUBLICATIONCHAPTER - SIMPLIFICATIONEXERCISE - TEST YOURSELF
25 Videos
- TIME AND DISTANCEBOOK - KIRAN PUBLICATIONCHAPTER - TIME AND DISTANCEEXERCISE - Type -XI
74 Videos
Similar Questions
The Pie-chart shows the result of a survey among 119060 people concerning the use of tobacco. Study the Pie-chart and answer the questions.
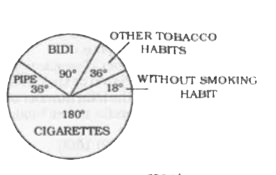
The number of people smoking Cigarettes is :
View SolutionThe Pie-chart shows the result of a survey among 119060 people concerning the use of tobacco. Study the Pie-chart and answer the questions.
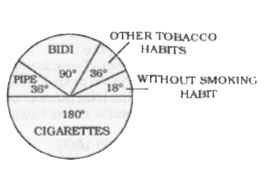
The number of people preferring Bidi is :
View Solution
Knowledge Check
Study the Pie chart carefully and answer the questions.
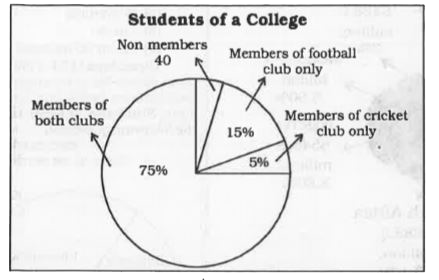
The number of students who are members of both the club is :A500B650C550D600The following pie-chart shows the preference of musical instruments of 60,000 people surveyed over whole India. Examine the chart and answer the questions.
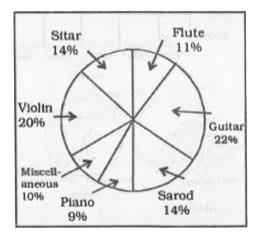
The number of people who prefer Guitar is greater than the total number of people who prefer either Flute or Piano by :A1200B1100C1300D1400The pie chart shows the result of an online survey which asked people about their favourite game. Study the diagram and answer the following questions.
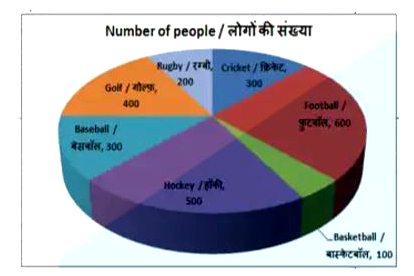
What is the total number of people who have responded to the survey?
(a)2100
(b)2200
(c)2400
(d)2500A2100B2200C2400D2500
The Pie-chart shows the result of a survey among 119060 people concerning the use of tobacco. Study the Pie-chart and answer the questions.
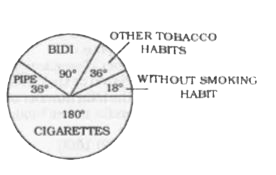
Let P be the percentage of people using Cigarettes, Pipe and Bidi as their smoking means and Q be the percentage of people using other means as their smoking habits. Then P is more than Q by :
View SolutionStudy the pie-chart and answer the questions.

The central angle for the sector on "Paper-Cost" is
View SolutionStudy the pie chart and answer the question
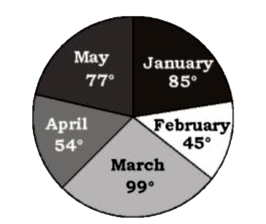
The total number of computers sold in February and April is what percentage more than the number of computers sold in May
View SolutionThe pie chart shows the result of an online survey which asked people about their favourite game. Study the diagram and answer the following questions.
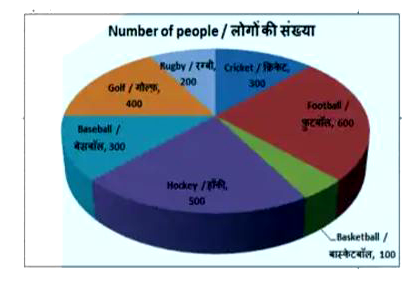
Which game is the favourite of most people surveyed?
View SolutionThe pie chart shows the results of an online survey which asked people about their favourite author. Study the diagram and answert he following questions.
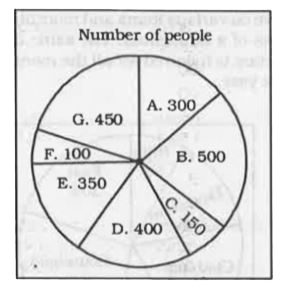
The measure of the central angle of the sector representing number fo people whose favourite author is D is ____ degrees.
View Solution
