Study the following pie chart carefully and answer the questions. The pie chart represents the percentage of people involved in various occupations.
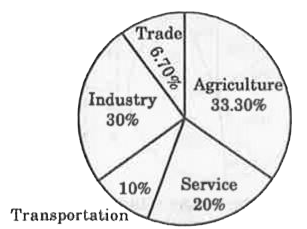
The difference between the maximum number of people involved and minimum number of people involved in various professions is
2640
3640
6320
5320
The correct Answer is:D
Step by step video, text & image solution for Study the following pie chart carefully and answer the questions. The pie chart represents the percentage of people involved in various occupations. The difference between the maximum number of people involved and minimum number of people involved in various professions is by Maths experts to help you in doubts & scoring excellent marks in Class 14 exams.
Topper's Solved these Questions
- BOOK - KIRAN PUBLICATIONCHAPTER - STATISTICS AND DATA INTERPRETATIONEXERCISE - TYPE-VIII8videos
STATISTICS AND DATA INTERPRETATION
- BOOK - KIRAN PUBLICATIONCHAPTER - STATISTICS AND DATA INTERPRETATIONEXERCISE - TYPE-VI86videos
STATISTICS AND DATA INTERPRETATION
- BOOK - KIRAN PUBLICATIONCHAPTER - SIMPLIFICATIONEXERCISE - TEST YOURSELF25videos
SIMPLIFICATION
- BOOK - KIRAN PUBLICATIONCHAPTER - TIME AND DISTANCEEXERCISE - Type -XI74videos
TIME AND DISTANCE
Similar Questions
Study the following pie chart and table to answer the question.
Total number of students admitted in a university in various fields = 5000
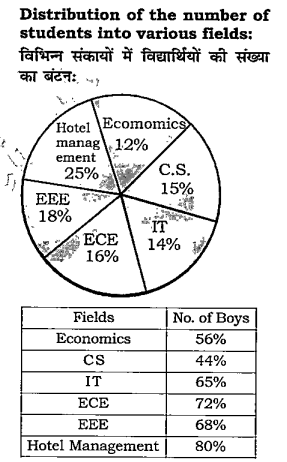 What is the difference between
the number of girls in IT and number of girls in ECE?
View SolutionStudy the Pie chart carefully and answer the questions.
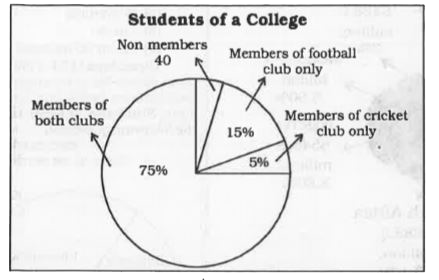
The number of students who are members of both the club is :View Solution
Knowledge Check
- Question 1 - Select One
Study the following pie chart carefully and answer the questions. The pie chart represents the percentage of people involved in various occupations.
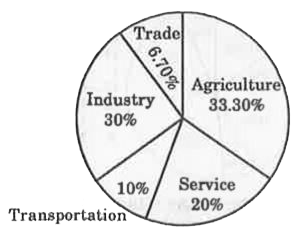
The ratio of the people involved in service to that in industry isA1:2B2:3C3:4D3:2 - Question 2 - Select One
Study the following pie chart carefully and answer the questions. The pie chart represents the percentage of people involved in various occupations.
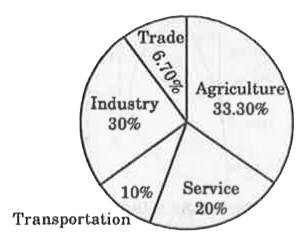
The angle made by the people involved in service in the given pie-chart isA36∘B90∘C72∘D108∘ - Question 3 - Select One
Study the following pie chart carefully and answer the questions. The pie chart represents the percentage of people involved in various occupations.(total number of people-20000).
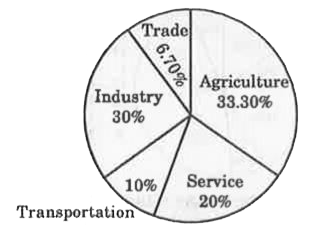
How many more people are involved in service than in trade?A3360B2660C1660D660
Study the Pie chart carefully and answer the questions.
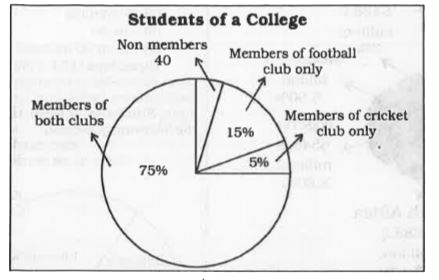
Percentage of students who are not members of any club is :View SolutionStudy the Pie chart carefully and answer the questions.
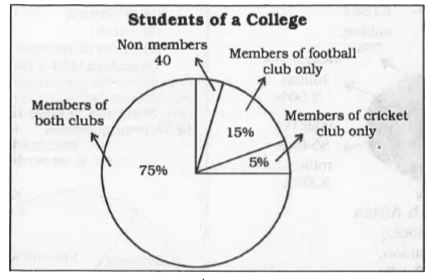
Number of students who are members of cricket club only :View SolutionStudy the following graph carefully and answer the questions given below it :-
Number of people working in various departments of two different organisation:
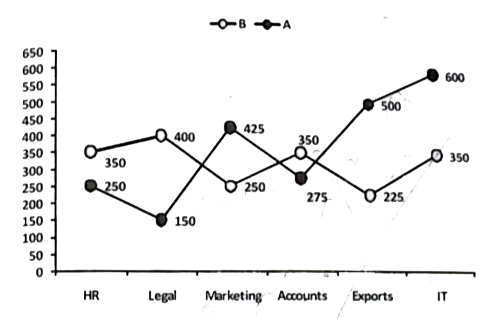
What is the total number of people working in organisation B?View SolutionStudy the following Pie-Chart carefully to answer the questions given below.
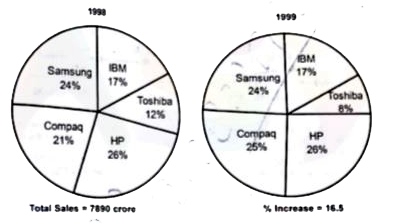
The percentage increase/decrease in the sales of Toshiba in 1999 is approximately-View SolutionStudy the following pie-chart carefully and answer the questions given below :-
Survey conducted on 12000 people of various professionals and percentage of female professionals
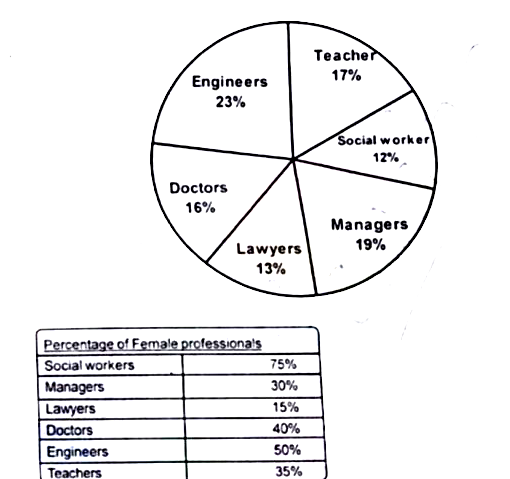
What is the difference between the total number of make and female professionals in the town ?View Solution

