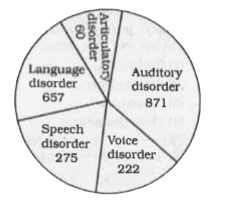
Directions : The Paichart shows Distribution of Spacial Childern Population the year 1994-96. Study the pie-chart and answer the following questions
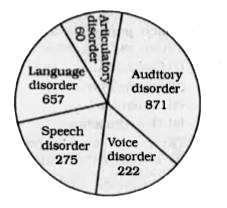
What is the respective ratio between language disorder and the average pf the remaining disorder cases?
219:119
119:219
919:419
729:529
The correct Answer is:A
Step by step video, text & image solution for Directions : The Paichart shows Distribution of Spacial Childern Population the year 1994-96. Study the pie-chart and answer the following questions What is the respective ratio between language disorder and the average pf the remaining disorder cases? by Maths experts to help you in doubts & scoring excellent marks in Class 14 exams.
Topper's Solved these Questions
- BOOK - KIRAN PUBLICATIONCHAPTER - STATISTICS AND DATA INTERPRETATIONEXERCISE - TYPE-VIII8videos
STATISTICS AND DATA INTERPRETATION
- BOOK - KIRAN PUBLICATIONCHAPTER - STATISTICS AND DATA INTERPRETATIONEXERCISE - TYPE-VI86videos
STATISTICS AND DATA INTERPRETATION
- BOOK - KIRAN PUBLICATIONCHAPTER - SIMPLIFICATIONEXERCISE - TEST YOURSELF25videos
SIMPLIFICATION
- BOOK - KIRAN PUBLICATIONCHAPTER - TIME AND DISTANCEEXERCISE - Type -XI74videos
TIME AND DISTANCE
Similar Questions
Directions : The Piechart shows Distribution of Special Children Population the year 1994-96. Study the pie-chart and answer the following questions

What is the respective ratio between language disorder and the average of the remaining disorder cases?View SolutionDirections : The Piechart shows Distribution of Special Children Population the year 1994-96. Study the pie-chart and answer the following questions
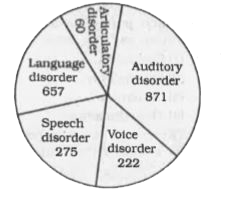
Find the ratio between articulatory disorder and speech disorder cases.View Solution
Knowledge Check
- Question 1 - Select One
Directions : The Paichart shows Distribution of Spacial Childern Population the year 1994-96. Study the pie-chart and answer the following questions

What is the respective ratio between language disorder and the average pf the remaining disorder cases?A219:119B119:219C919:419D729:529 - Question 2 - Select One
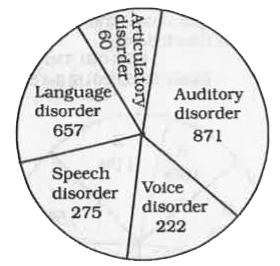
The pie-chart shows Distribution of Special Children Population during the year 1994-96. Study the pie-chart and answer the following questions.
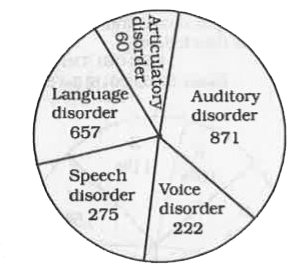
Find the ratio between articulatory disorder and speech disorder cases.A21:55B55:21C55:12D12:55 - Question 3 - Select One
Directions : The Paichart shows Distribution of Spacial Childern Population the year 1994-96. Study the pie-chart and answer the following questions

Find the ratio between atrticulatory diorder and speech disorder cases.A43.7%B42.7%C41.7%D40.7%
Directions : The Piechart shows Distribution of Special Children Population the year 1994-96. Study the pie-chart and answer the following questions
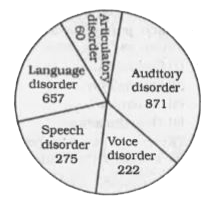
Find the approximate percentage distribution of children with auditory disorder.View SolutionDirections : The Piechart shows Distribution of Special Children Population the year 1994-96. Study the pie-chart and answer the following questions
What is the average number of cases in different types of special children during the year 1994-96?View SolutionDirection: Study the chart and answer the following questions

What is the average expenditure spent on different five sector over the year?View SolutionThe pie-chart shows Distribution of Special Children Population during the year 1994-96. Study the pie-chart and answer the following questions.
What is the average number of cases in different types of special children during the year 1994-96?View SolutionThe pie chart shows the breakup of expenditure of a college for the year 2017. Study the diagram and answer the following questions.
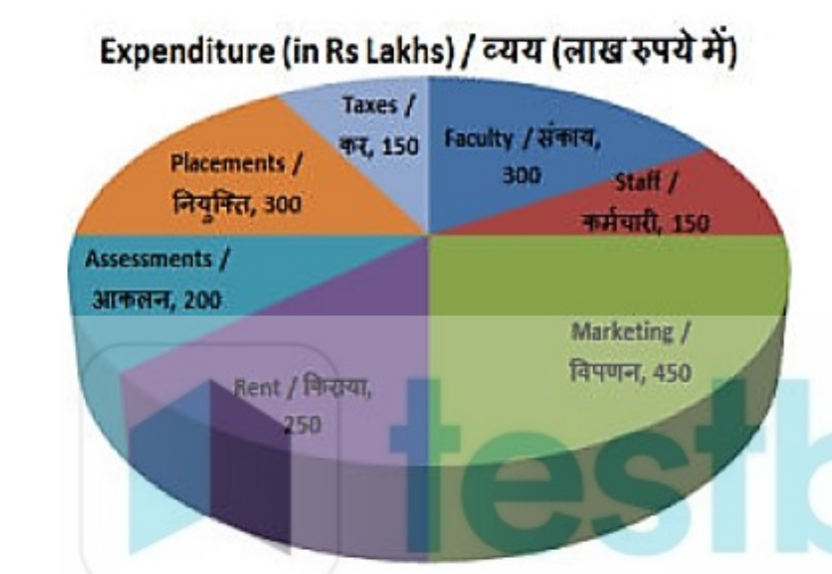
What is the total expenditure (in Rs lakhs)?View Solution

