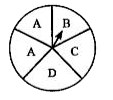
Data represented using circles is calledSolution in Punjabi
Bar graph
pictograph
pie chart
None
The correct Answer is:C
Step by step video, text & image solution for Data represented using circles is called by Maths experts to help you in doubts & scoring excellent marks in Class 8 exams.
Updated on:21/07/2023Topper's Solved these Questions
- DATA HANDLING BOOK - NAND LAL PUBLICATIONCHAPTER - DATA HANDLING EXERCISE - ADDITIONAL QUESTIONS FOR PRACTICE (Short Answer Type Questions)
2 Videos
- DATA HANDLING BOOK - NAND LAL PUBLICATIONCHAPTER - DATA HANDLING EXERCISE - ADDITIONAL QUESTIONS FOR PRACTICE (Long Answer Type Questions)
14 Videos
- DATA HANDLING BOOK - NAND LAL PUBLICATIONCHAPTER - DATA HANDLING EXERCISE - EXERCISE-5.3
6 Videos
- CUBES AND CUBE ROOTSBOOK - NAND LAL PUBLICATIONCHAPTER - CUBES AND CUBE ROOTSEXERCISE - Sample Paper For Practice
18 Videos
- DIRECT AND INVERSE PROPORTIONSBOOK - NAND LAL PUBLICATIONCHAPTER - DIRECT AND INVERSE PROPORTIONSEXERCISE - SAMPLE PAPER FOR PRACTICE ( Fill in the blanks )
17 Videos
Similar Questions
Following are the numbers of members in 25 familles of a village 7, 9, 8, 8, 7, 6, 4, 3, 7, 9, 8, 8, 5, 4, 7, 7, 7, 8, 6, 5, 4, 4, 3, 6, 5
Prepare a frequency distribution table for the data using class intervals 0-3, 3-6............so on.
View SolutionDraw a pie chart for the following data. Number of students studying languages in a school.

View SolutionList the outcomes you can see in the these experiments :
(a) Spinning a wheel
(b) Tossing two coins together

View SolutionCube of a natural number 5 will end with the digit
View SolutionSpeed of moving objects varies inversely to the ________ to cover a certain distance.
View SolutionRepresent the following data, using a percentage bar diagram :

View SolutionRepresent the following data using a histogram.

View SolutionEmply circles are used to represent
View SolutionWhat type of graph would you use to represent the following data?

View SolutionRepresenting the data with the help of pictures is called ..........
View Solutionसंकेतों का प्रयोग करते हुए आकड़ों के चित्रीय निरूपण को कहते हैं :
View Solutionएक आकृति जो आँकड़ों को चित्ररूप में प्रदर्षित करती है, कहलाती है :
View SolutionThe representation of data using circles is called
View Solutionवृत्त के रूप में निरूपित आंकड़ों को ______ कहा जाता है:
View SolutionState a situation in which you use a line diagram to represent the data.
View SolutionData represented using circles is known as
View Solution
