Fill in the blanks.
A pie chart is a circle graph divided into ______.Solution in Punjabi
The correct Answer is:sectors
Step by step video, text & image solution for Fill in the blanks. A pie chart is a circle graph divided into ______. by Maths experts to help you in doubts & scoring excellent marks in Class 8 exams.
Updated on:21/07/2023Topper's Solved these Questions
- DATA HANDLING BOOK - NAND LAL PUBLICATIONCHAPTER - DATA HANDLING EXERCISE - ADDITIONAL QUESTIONS FOR PRACTICE (Short Answer Type Questions)
2 Videos
- DATA HANDLING BOOK - NAND LAL PUBLICATIONCHAPTER - DATA HANDLING EXERCISE - ADDITIONAL QUESTIONS FOR PRACTICE (Long Answer Type Questions)
14 Videos
- DATA HANDLING BOOK - NAND LAL PUBLICATIONCHAPTER - DATA HANDLING EXERCISE - EXERCISE-5.3
6 Videos
- CUBES AND CUBE ROOTSBOOK - NAND LAL PUBLICATIONCHAPTER - CUBES AND CUBE ROOTSEXERCISE - Sample Paper For Practice
18 Videos
- DIRECT AND INVERSE PROPORTIONSBOOK - NAND LAL PUBLICATIONCHAPTER - DIRECT AND INVERSE PROPORTIONSEXERCISE - SAMPLE PAPER FOR PRACTICE ( Fill in the blanks )
17 Videos
Similar Questions
Following are the numbers of members in 25 familles of a village 7, 9, 8, 8, 7, 6, 4, 3, 7, 9, 8, 8, 5, 4, 7, 7, 7, 8, 6, 5, 4, 4, 3, 6, 5
Prepare a frequency distribution table for the data using class intervals 0-3, 3-6............so on.
View SolutionDraw a pie chart for the following data. Number of students studying languages in a school.

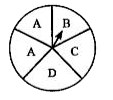
View SolutionList the outcomes you can see in the these experiments :
(a) Spinning a wheel
(b) Tossing two coins together

View SolutionCube of a natural number 5 will end with the digit
View SolutionSpeed of moving objects varies inversely to the ________ to cover a certain distance.
View SolutionFill in the blanks : The given pie chart shows the information on consumption of different soap powders in a survey Brand Consumption:
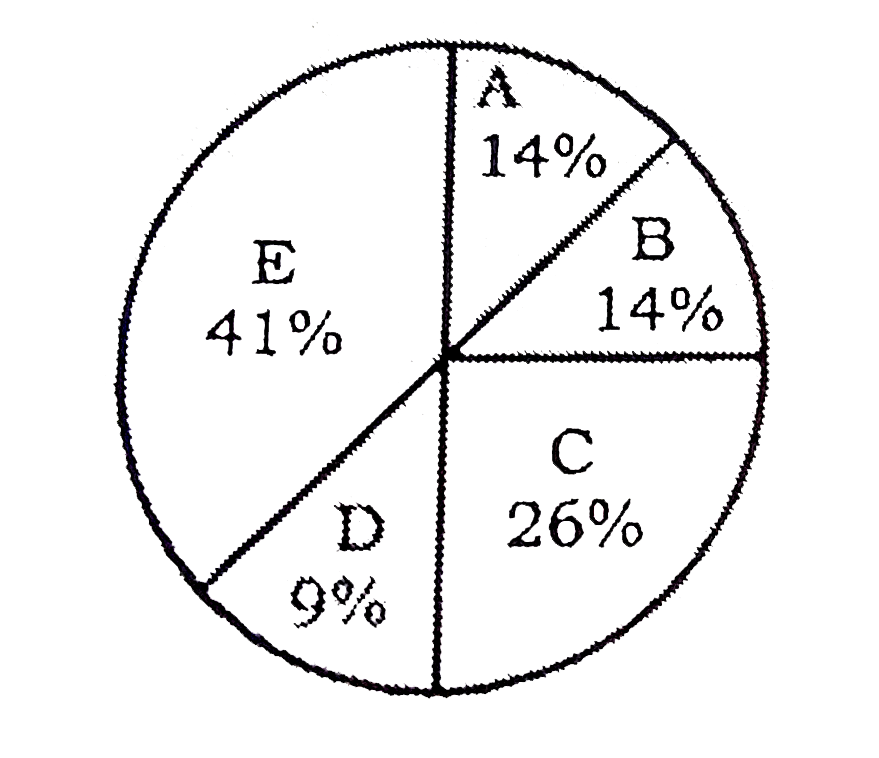
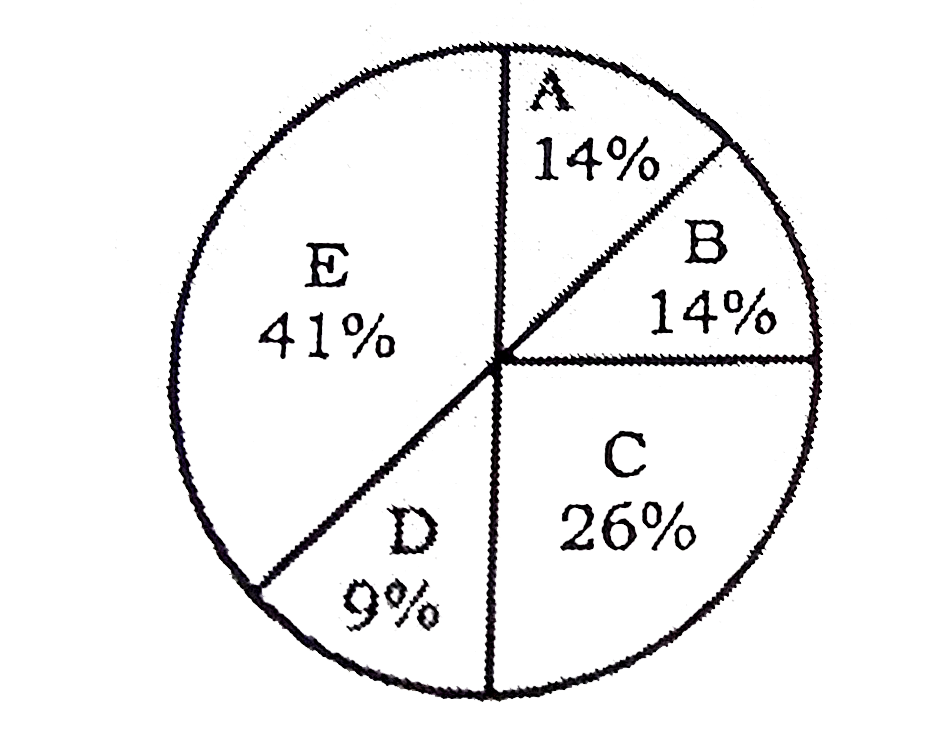
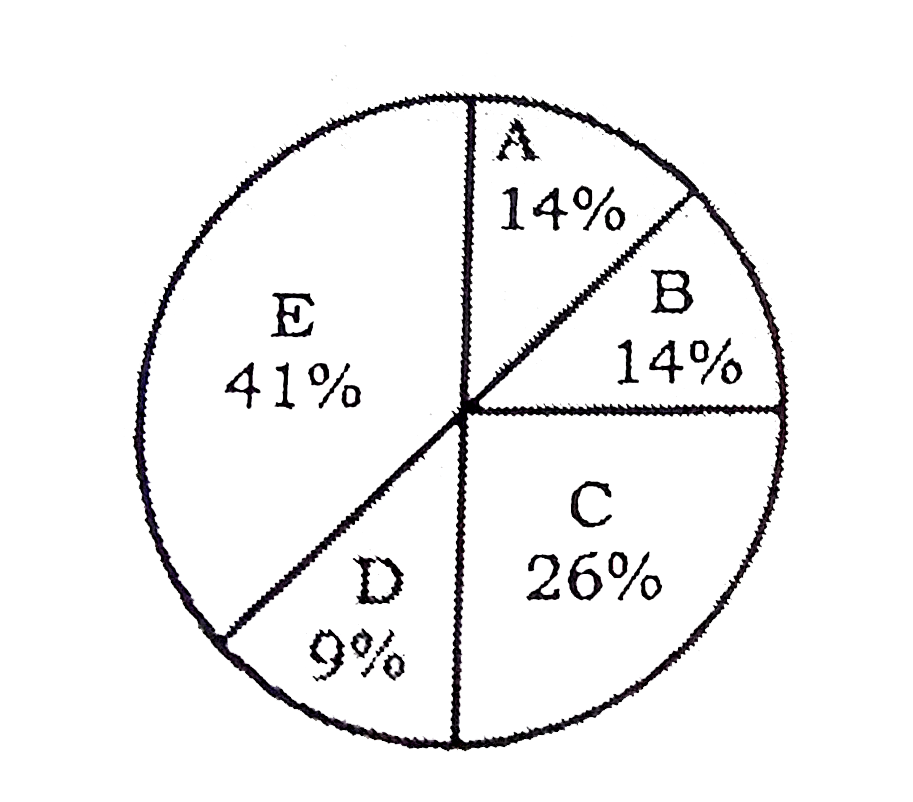
View Solutionनिर्देश :- केंद्र सरकार द्वारा अर्जित राजस्व वृत्त चार्ट (पाई चार्ट ) में दर्शाया गया है इस चार्ट का अध्ययन करे और निम्नलिखित 4 प्रश्नो के उत्तर दे ।

View Solutionनिर्देश :- केंद्र सरकार द्वारा अर्जित राजस्व वृत्त चार्ट (पाई चार्ट ) में दर्शाया गया है इस चार्ट का अध्ययन करे और निम्नलिखित 4 प्रश्नो के उत्तर दे ।

View Solutionनिर्देश :- केंद्र सरकार द्वारा अर्जित राजस्व वृत्त चार्ट (पाई चार्ट ) में दर्शाया गया है इस चार्ट का अध्ययन करे और निम्नलिखित 4 प्रश्नो के उत्तर दे ।

View Solutionखाली स्थान भरिए :
एक वृत्त, जिस तल पर स्थित है, उसे ....................... भागों में विभाजित करता है |
View Solutionकिसी परीक्षा में एक विद्यार्थी के विभिन्न विषयों के प्राप्तांक निम्न रूप हैं
 इन आँकड़ों के लिए एक वृत्त आलेख (पाई चार्ट) खींचिए।
View Solutionਖਾਲੀ ਥਾਂ ਭਰੋ:- ਇੱਕ ਚੱਕਰ, ਜਿਸ ਤਲ ਵਿੱਚ ਸਥਿਤ ਹੈ, ਉਸਨੂੰ_______ਭਾਗਾਂ ਵਿੱਚ ਵੰਡਦਾ ਹੈ।
View SolutionFill in the blanks with the help of chart.
View SolutionFill in the blanks: Kerosene diesel pie results in _______________ purification.
View Solutionশূন্যস্থান পূরণ করো- একটি বৃত্ত যে তলে অবস্থিত সেই তলটিকে ওই বৃত্তটি __________ টি ভাগে বিভক্ত করে |
View SolutionIn a pie chart, a perfect circle is divided into sectors.
View Solution
