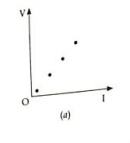
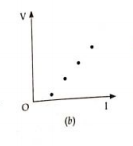
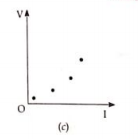
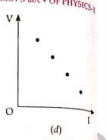
4 students plotted the graph showing dependence of current I on potential difference V across using their recorded observations. The most appropriate graph isSolution in Punjabi


Step by step video & image solution for 4 students plotted the graph showing dependence of current I on potential difference V across using their recorded observations. The most appropriate graph is by Physics experts to help you in doubts & scoring excellent marks in Class 10 exams.
Updated on:21/07/2023Topper's Solved these Questions
Similar Questions
Define electric current and give its unit
View SolutionWrite the S.I. unit of magnetic field →B.
View SolutionGraphs plotted by four students A, B, C and D for the experiment "To study the dependence of current (I) on the potential difference (V) across a resistor" are shown below :

The correct V-I graph is :
View SolutionWhile stud dying the dependence of potential difference (V) across a resistor on the current
(I) passing through it, in order to determine the resistance of the resistor, a student took
5 readings for different values of current and plotted a graph between V and I. He got a
straight line graph passing through the origin. What does the straight line signify? Write
the method of determining resistance of the resistor using this graph.
View SolutionThe values of current I flowing in a given resistor for the corresponding values or potential difference V across the resistor are given below

Plot a graph between V and I and calculate the resistance of that resistor.
View SolutionThe values of current I flowing in a given resistor for the corresponding values of potential difference V across the resistor are given below –

Plot a graph between V and I and calculate the resistance of that resistor.
View SolutionThe potential difference V is proportional to the current I, the graph between V and I is a . . . . .. . . . . .
View SolutionPlot a graph which shows the dependence of current I on potential difference V across a resistor R .
View SolutionA graph is plotted between the potential difference (applied across the ends of a conductor) and the current (following through the conductor). The graph is a straight line
View SolutionWhile stud dying the dependence of potential difference (V) across a resistor on the current
(I) passing through it, in order to determine the resistance of the resistor, a student took
5 readings for different values of current and plotted a graph between V and I. He got a
straight line graph passing through the origin. What does the straight line signify? Write
the method of determining resistance of the resistor using this graph.
View Solutionएक छात्र एक सेल (जिसका वि. वा. बल. (emf) है ओर आन्तरिक प्रतिरोध r है) के टर्मिनलों के विभवांतर (V) के सेल में चल रही धारा (I) से संबंध जानने के लिये V और I के बीच ग्राफ बनाता है। इस ग्राफ की प्रवणता और अंतः खण्ड क्रमानुसार होंगे
View SolutionThe values of current I flowing in for the corresponding values of potential difference V across the resistor are given below : Plot a graph between V and I and calculate the resistance of that resistor.
View SolutionDraw a graph of potential difference (V) versus current (I) for an ohmic resistor.
View SolutionDraw a graph of Potential difference (V) versus Current (I) for an ohmic resistor.
View SolutionIn an experiment of verification of Ohm's law, following observations are obtained.

Draw a V-I graph and use this graph to find :
the potential difference V when the current / is 0-5 A,
View SolutionIn an experiment of verification of Ohm's law, following observations are obtained.

Draw a V-I graph and use this graph to find :
the current / when the potential difference V is 0.75 V,
View Solution
