Given bar graph shows the number of books of difference subjects kept in a library. Study it and answer the following questions :
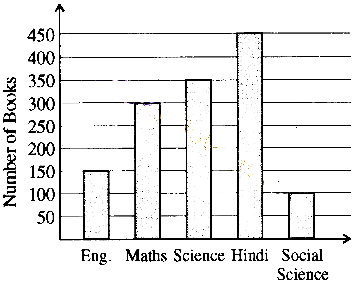
How many Hindi books are kept in the library ?
The correct Answer is:450
Step by step video, text & image solution for Given bar graph shows the number of books of difference subjects kept in a library. Study it and answer the following questions : How many Hindi books are kept in the library ? by Maths experts to help you in doubts & scoring excellent marks in Class 6 exams.
Topper's Solved these Questions
- BOOK - MTG IIT JEE FOUNDATIONCHAPTER - DATA HANDLING EXERCISE - Solved Examples37videos
DATA HANDLING
- BOOK - MTG IIT JEE FOUNDATIONCHAPTER - DATA HANDLING EXERCISE - NCERT Section (Exercise 9.1)22videos
DATA HANDLING
- BOOK - MTG IIT JEE FOUNDATIONCHAPTER - BASIC GEOMETRICAL IDEASEXERCISE - OLYMPIAD/HOTS CORNER10videos
BASIC GEOMETRICAL IDEAS
- BOOK - MTG IIT JEE FOUNDATIONCHAPTER - DECIMALSEXERCISE - OLYMPIAD/HOTS CORNER20videos
DECIMALS
Similar Questions
Given bar graph shows the number of books of difference subjects kept in a library. Study it and answer the following questions :
Which subject has minimum number of books in the library ?View SolutionGiven bar graph shows the number of books of difference subjects kept in a library. Study it and answer the following questions :
Are number of books of Science more than that of Mathematics ? If yes, then by how much ?View Solution
Knowledge Check
- Question 1 - Select One
The bar graph shows the number of employees working in the different departments of a company. Study the diagram and answer the following questions
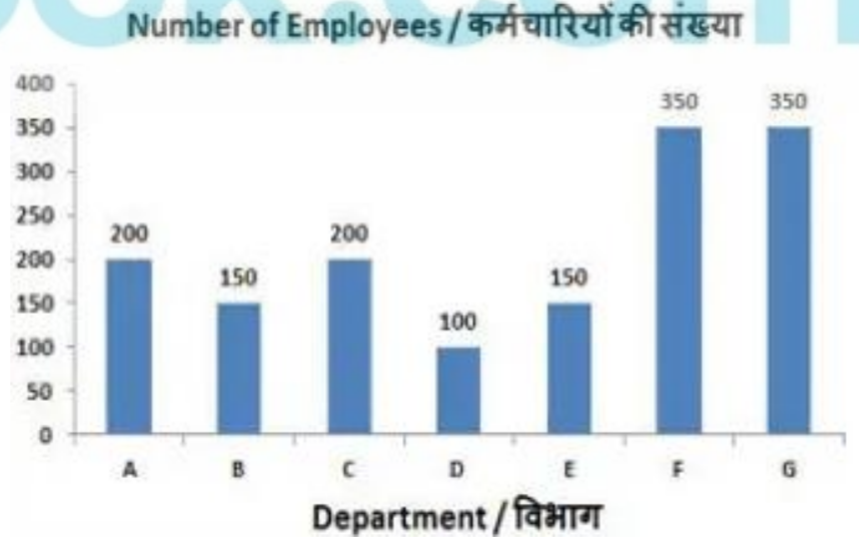
Which department has the lowest number of employees?ACBDCADB - Question 2 - Select One
The bar graph shows the number of soldiers in the armies of different countries. Study the diagram and answer the following questions.
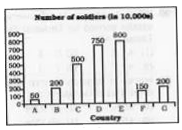
Which country has the least number of soldiers?AABDCFDB
The given pictograph shows the books of different subjects kept in a school library ?
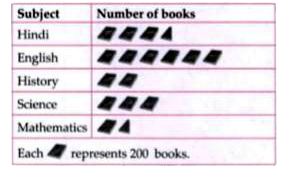
How many English book are there in the library ?View SolutionRead the bar graph which shows the number of books sold by a bookstore during five consecutive years and answer the following questions
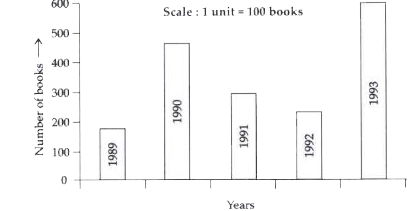
In which year lowest books were sold ?View SolutionThe following bar graph shows the number of houses (out of 100) in a town using different types of fuels for cooking.
Read the bar graph and answer the following questions:
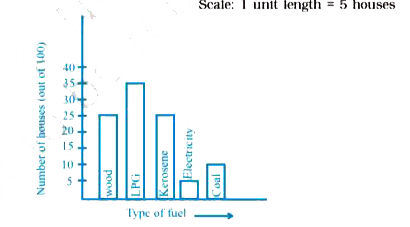
How many houses are using coal as fuel?View SolutionThe given pictograph shows the books of different subjects kept in a school library ?
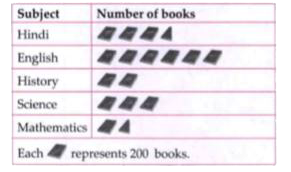
How many Mathematics books are there in the library ?View SolutionDirections: The following bar graph shows the number of pages in five different books (viz. A, B, C, D and E). Study the graph carefully and answer the following questions.
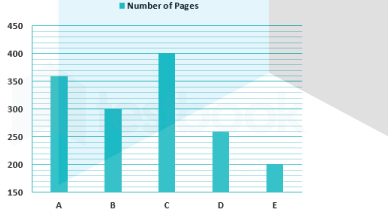
After reading l/5th of the pages of book E, how many pages remain unread?View SolutionDirections: The following bar graph shows the number of pages in five different books (viz. A, B, C, D and E). Study the graph carefully and answer the following questions.
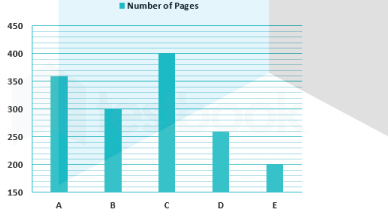
What is the ratio of total number of pages in book B and E together to the total number of pages in book C and D together?View Solution

