51 students from a locality use different modes of transport to go to school as shown by the bar graph given below.
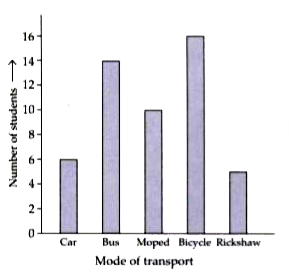
Assertion : Bicycle is used by maximum number of students.
Reason : Height of bar corresponding to bicycle is maximum. So, most students use bicycle to go to school.
If both assertion and reason are true and reason is the correct explanation of assertion.
If both assertion and reason are true but reason is not the correct explanation of assertion.
If assertion is true but reason is false.
If assertion is false but reason is true.
The correct Answer is:A
Step by step video & image solution for 51 students from a locality use different modes of transport to go to school as shown by the bar graph given below. Assertion : Bicycle is used by maximum number of students. Reason : Height of bar corresponding to bicycle is maximum. So, most students use bicycle to go to school. by Maths experts to help you in doubts & scoring excellent marks in Class 6 exams.
Updated on:21/07/2023Topper's Solved these Questions
- DATA HANDLING BOOK - MTG IIT JEE FOUNDATIONCHAPTER - DATA HANDLING EXERCISE - Exercise (Comprehension Type )
6 Videos
- DATA HANDLING BOOK - MTG IIT JEE FOUNDATIONCHAPTER - DATA HANDLING EXERCISE - Exercise (Subjective Problems (Very Short Answer Type))
9 Videos
- DATA HANDLING BOOK - MTG IIT JEE FOUNDATIONCHAPTER - DATA HANDLING EXERCISE - Exercise (Match the following)
2 Videos
- BASIC GEOMETRICAL IDEASBOOK - MTG IIT JEE FOUNDATIONCHAPTER - BASIC GEOMETRICAL IDEASEXERCISE - OLYMPIAD/HOTS CORNER
10 Videos
- DECIMALSBOOK - MTG IIT JEE FOUNDATIONCHAPTER - DECIMALSEXERCISE - OLYMPIAD/HOTS CORNER
20 Videos
Similar Questions
70 students from a locality use different modes of transport to go to school as given below:

Draw the bar graph representing the above data.
View Solution70 students from a locality use different modes of transport to go to school as given below:
 Draw the bar graph representing the above data.
View Solution
Knowledge Check
The histogram shows the number of students using different modes of transport to commute from residence to school.
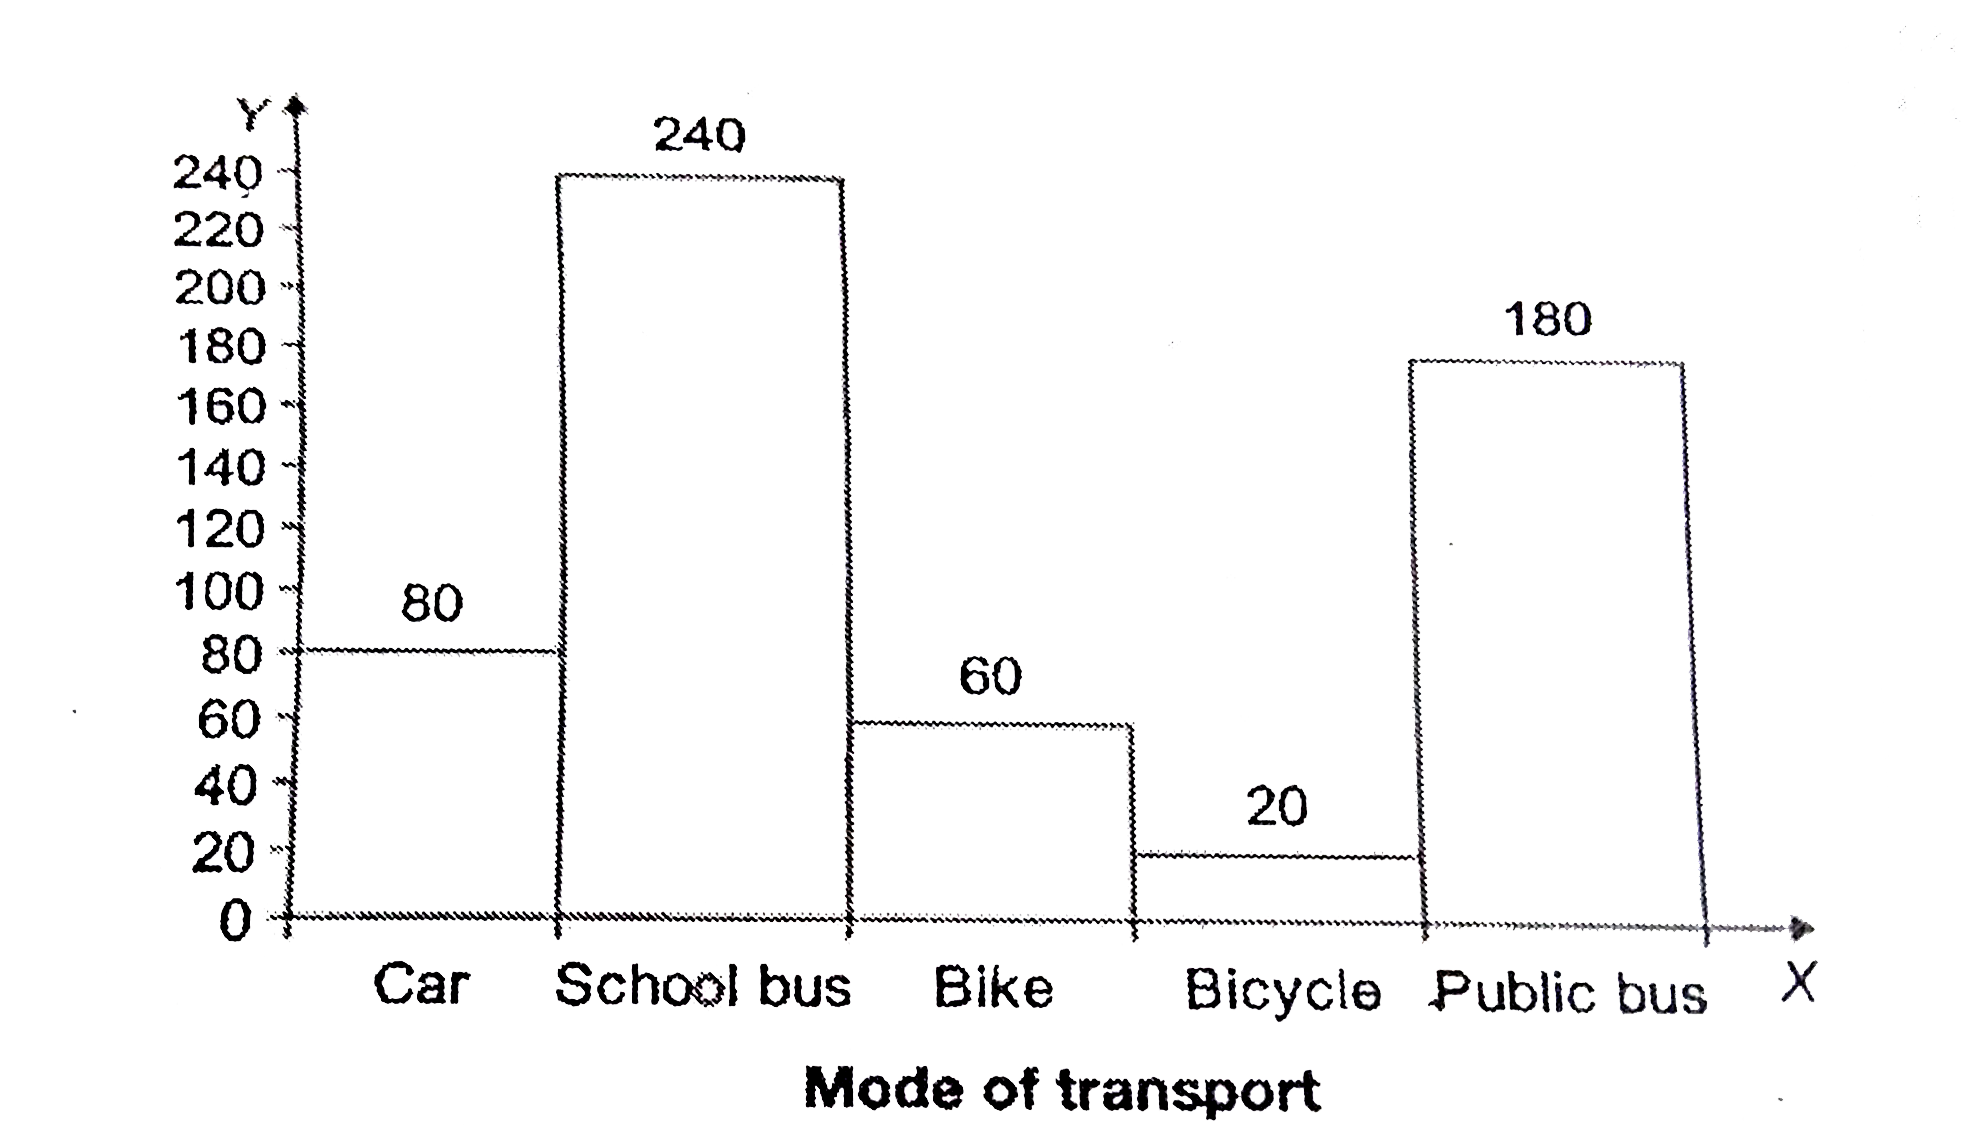
From the bar graph, answer the following question :
What is the total number of pupils who travel by school bus and bike ?A200B320C300D100The pie-chart given below represents the number of students using different transport to a school in which total number of students is 2160.
Answer the questions based on the following diagram.
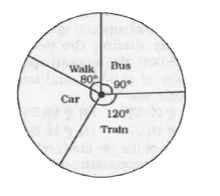
The ratio of the number of students who come to school by car to the number of students who come to school by bus isA21:24B21:27C36:27D36:21
51 students from a locality use different modes of transport to school, as shown by the bar graph given below:
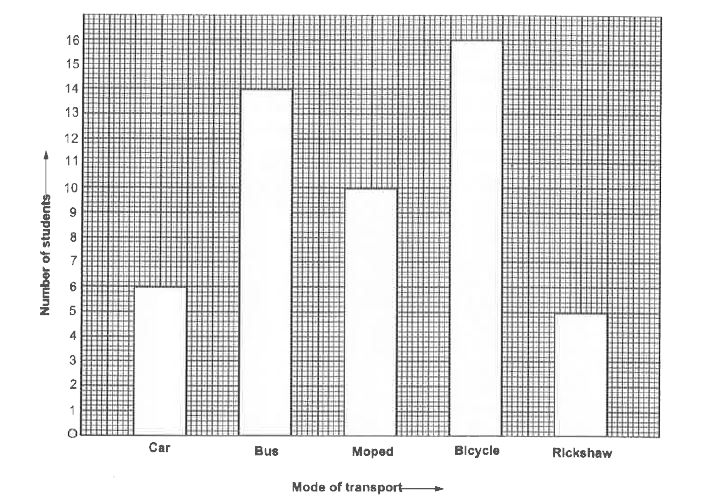
Look at the bar graph given above and answer the question given below:
What does the above bar graph show ?
Which mode of transport is used by maximum number of students ?
How many students use bus for going to school ?
How many students of the locality do not use bus for going to school ?
View SolutionRead the bar graph given below and answer the following questions:
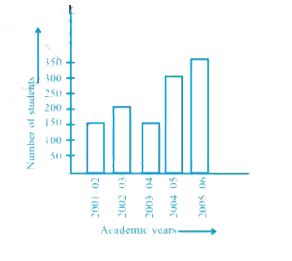
In which year is the number of students maximum?
View SolutionRead the bar graph given below and answer the following questions:
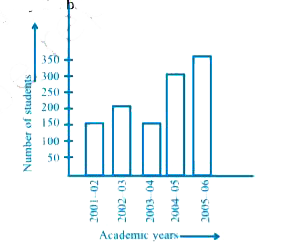
In which year is the increase in number of students maximum as compared to the previous year?
View SolutionRead the bar graph carefully and answer the following questions.
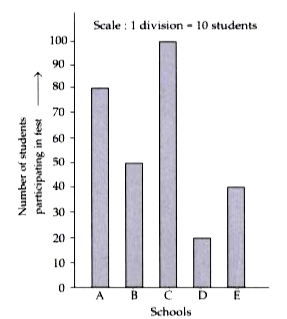 From which school maximum number of students participated ?
View SolutionRead the given bar graph, showing the number of games played by different number of students of a school.
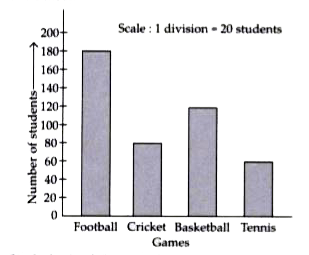
Which game is played by the maximum number of students ?
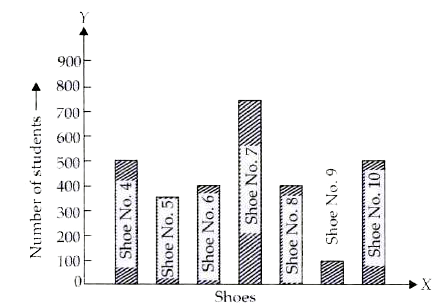
View SolutionRead the bar graph shown in figure and answer the following questions.
Which shoe number is worn by the maximum number of students? Also give its number
View Solution
