The pictograph shows the number of computers sold by a company during a week.
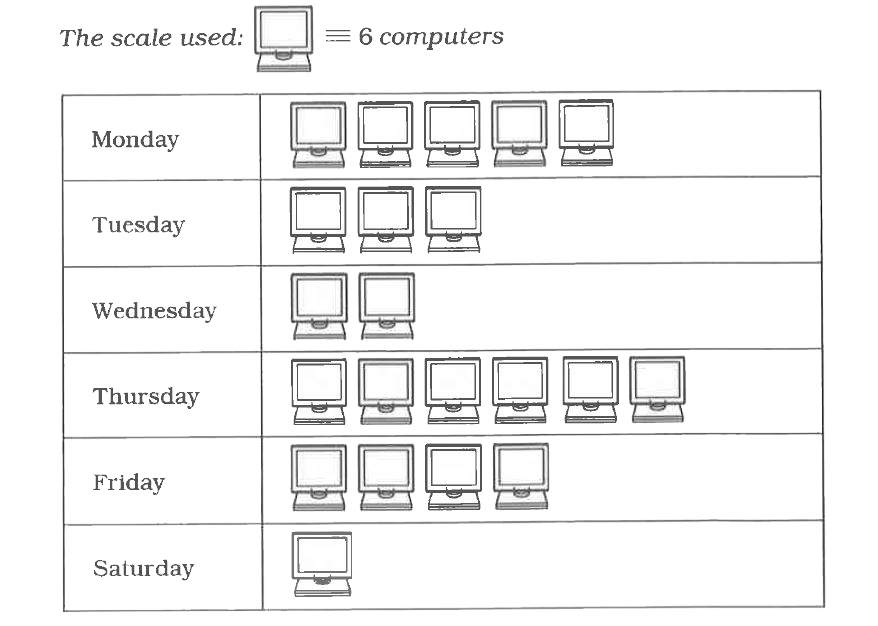
Look at the ptctograph and answer the question given bwlow.
How many computers were sold on Friday ?
How many computers were sold on Monday ?
How many computers were sold during the week ?
On which day was the sale maximum ?
If both assertion and reason are true and reason is the correct explanation of assertion.
If both assertion and reason are true but reason is not the correct explanation of assertion.
If assertion is true but reason is false.
If assertion is false but reason is true.
The correct Answer is:B
Step by step video & image solution for The pictograph shows the number of computers sold by a company during a week. Look at the ptctograph and answer the question given bwlow. How many computers were sold on Friday ? How many computers were sold on Monday ? How many computers were sold during the week ? On which day was the sale maximum ? by Maths experts to help you in doubts & scoring excellent marks in Class 6 exams.
Updated on:21/07/2023Topper's Solved these Questions
- DATA HANDLING BOOK - MTG IIT JEE FOUNDATIONCHAPTER - DATA HANDLING EXERCISE - Exercise (Comprehension Type )
6 Videos
- DATA HANDLING BOOK - MTG IIT JEE FOUNDATIONCHAPTER - DATA HANDLING EXERCISE - Exercise (Subjective Problems (Very Short Answer Type))
9 Videos
- DATA HANDLING BOOK - MTG IIT JEE FOUNDATIONCHAPTER - DATA HANDLING EXERCISE - Exercise (Match the following)
2 Videos
- BASIC GEOMETRICAL IDEASBOOK - MTG IIT JEE FOUNDATIONCHAPTER - BASIC GEOMETRICAL IDEASEXERCISE - OLYMPIAD/HOTS CORNER
10 Videos
- DECIMALSBOOK - MTG IIT JEE FOUNDATIONCHAPTER - DECIMALSEXERCISE - OLYMPIAD/HOTS CORNER
20 Videos
Similar Questions
Knowledge Check
Study the graph carefully and answer the following questions.
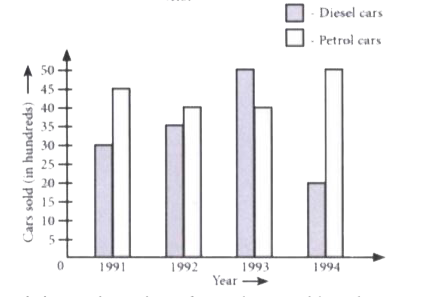
How many cars were sold during the year 1991?A9000B6500C7500D7000
The pictograph shows the number of bicycles made by a factory during the four weeks of a month. Answer the following questions.
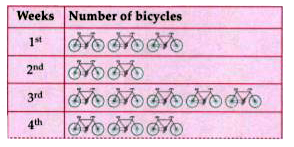

How many bicycles were made by the factory during 1st week ?
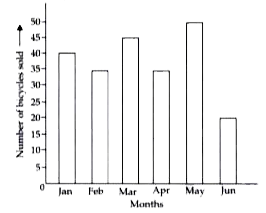
View SolutionLook at the bar graph and answer the following questions.
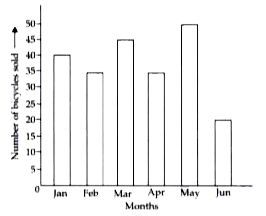
How many less bicycles sold in June than in March?
View SolutionThe pictograph shws different kinds of trees planted in a park. Each symbol represents 8 trees. Look at the pictograph and answer the question given below.
How many mango trees are there ?
How many banyan trees are there ?
How many neem trees are there ?
How many trees are there in all ?
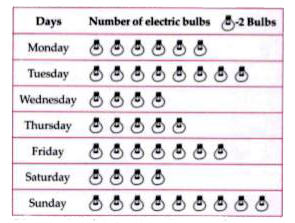
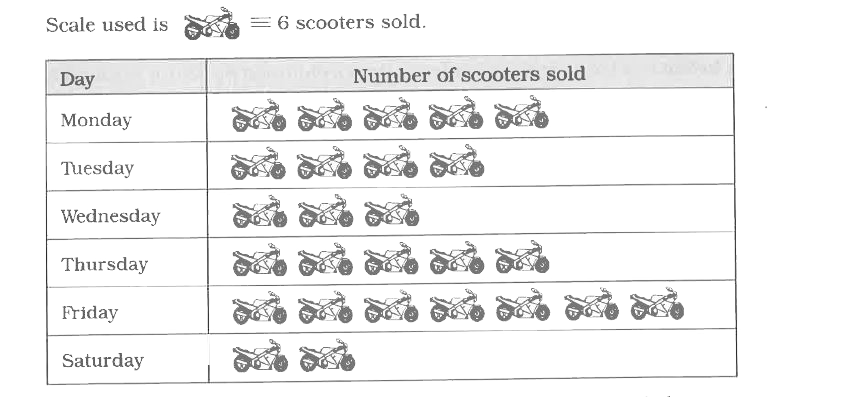
How many scooters were sold on Monday ?
How many scooters were sold on Tuesday ? Study the pictograph carefully and answer the question given below:
On what day of the week was the sale of the scooters maximum ? How many scooters were sold on that day ?
On what day of the week was the sale of the scooters minimum? How many scooters were sold on that day ?
View SolutionThe pictograph shows the number of bicycles made by a factory during the four weeks of a month. Answer the following questions.
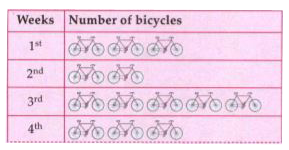

In which week maximum number of bicycles were made ?
View SolutionThe sale of number of dolls on different days of a week in a shopping mall is shown below :
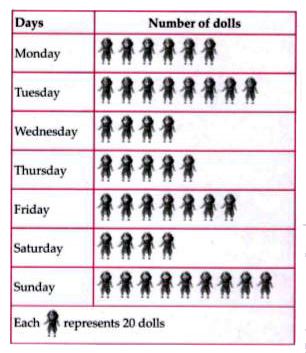
Observe the pictograph and answer the following questions.
How many dolls were sold on Tuesday ?
View SolutionRead the bar graph which shows the number of books sold by a bookstore during five consecutive years and answer the following questions
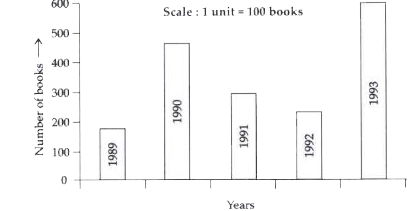
In which year lowest books were sold ?
View SolutionThe given bar graph shows the number of cars sold from Jan to Dec.
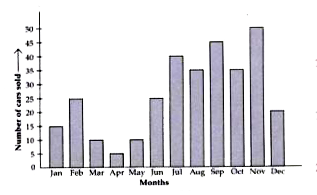
How many cars were sold in the last quarter of the year?
View Solution

