The bar graph shows the approximate length of different types of clothes produced in a factory.
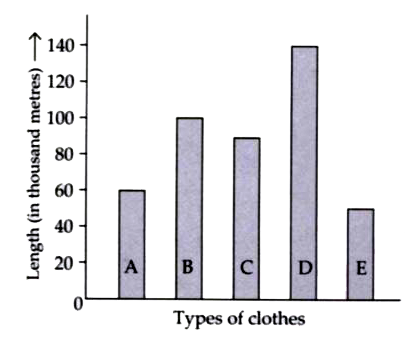
If the length of cloth B produced is P metres, then the value of P÷5 thousand is _______ .
The correct Answer is:20
Step by step video & image solution for The bar graph shows the approximate length of different types of clothes produced in a factory. If the length of cloth B produced is P metres, then the value of P div 5 thousand is _______ . by Maths experts to help you in doubts & scoring excellent marks in Class 6 exams.
Updated on:21/07/2023Topper's Solved these Questions
- DATA HANDLING BOOK - MTG IIT JEE FOUNDATIONCHAPTER - DATA HANDLING EXERCISE - Olympiad/HOTS Corner
10 Videos
- DATA HANDLING BOOK - MTG IIT JEE FOUNDATIONCHAPTER - DATA HANDLING EXERCISE - Exercise (Subjective Problems (Long Answer Type)
10 Videos
- BASIC GEOMETRICAL IDEASBOOK - MTG IIT JEE FOUNDATIONCHAPTER - BASIC GEOMETRICAL IDEASEXERCISE - OLYMPIAD/HOTS CORNER
10 Videos
- DECIMALSBOOK - MTG IIT JEE FOUNDATIONCHAPTER - DECIMALSEXERCISE - OLYMPIAD/HOTS CORNER
20 Videos
Similar Questions
The bar graph shows the number of toys produced by a factory during a certain week.
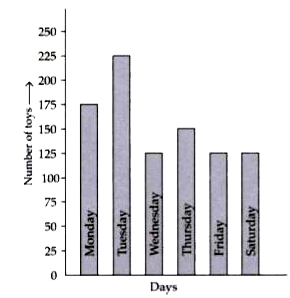
What is the total number of toys produced during the week ?
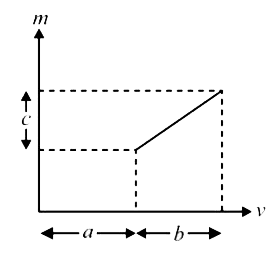
View SolutionThe graph shows how the magnification m produced by a thin lens varies with image distance v. What is the focal length of the lens used?
View Solution
Knowledge Check
The bar graph shows the production of the different departments of a company. Study the diagram and answer the following questions.
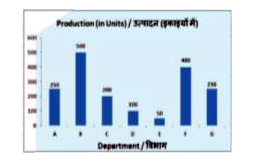
If the average cost a unit produced by department C is Rs 250 then what is the cost of the production (in Rs) of all units produced by department C?A50000B5000C250000D25000The graph show the behaviour of a length of wire in the region for which the substances obeys Hooke's law. P and Q represent
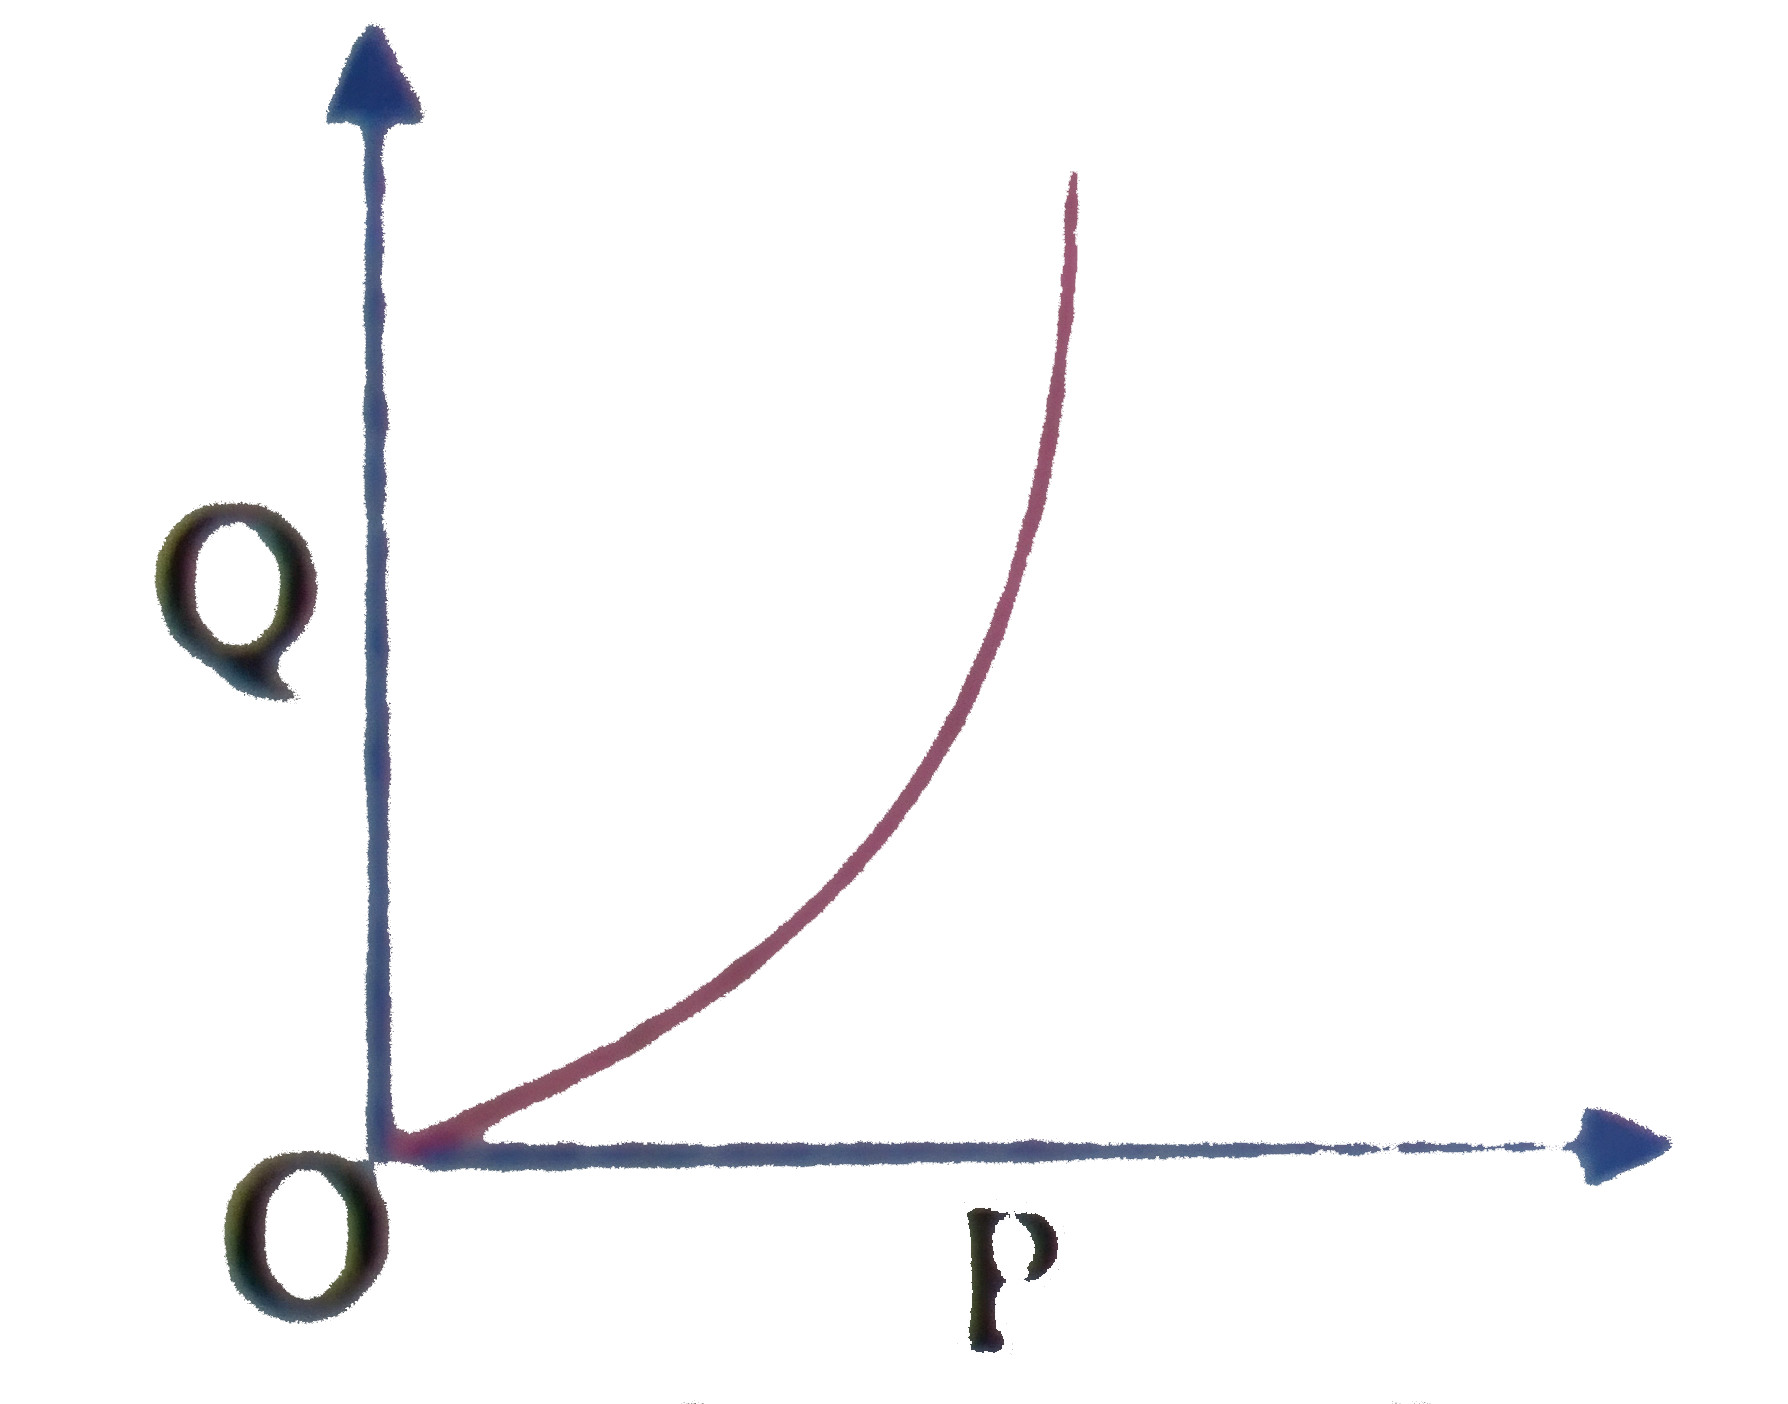 AP = applied force, Q = extensionBextension, applied forceCextension, stored elastic energyDstored elastic energy, extension
The graph shows how the magnification m produced by a convex thin lens varies with image distance v. What was the focal length of the used ?
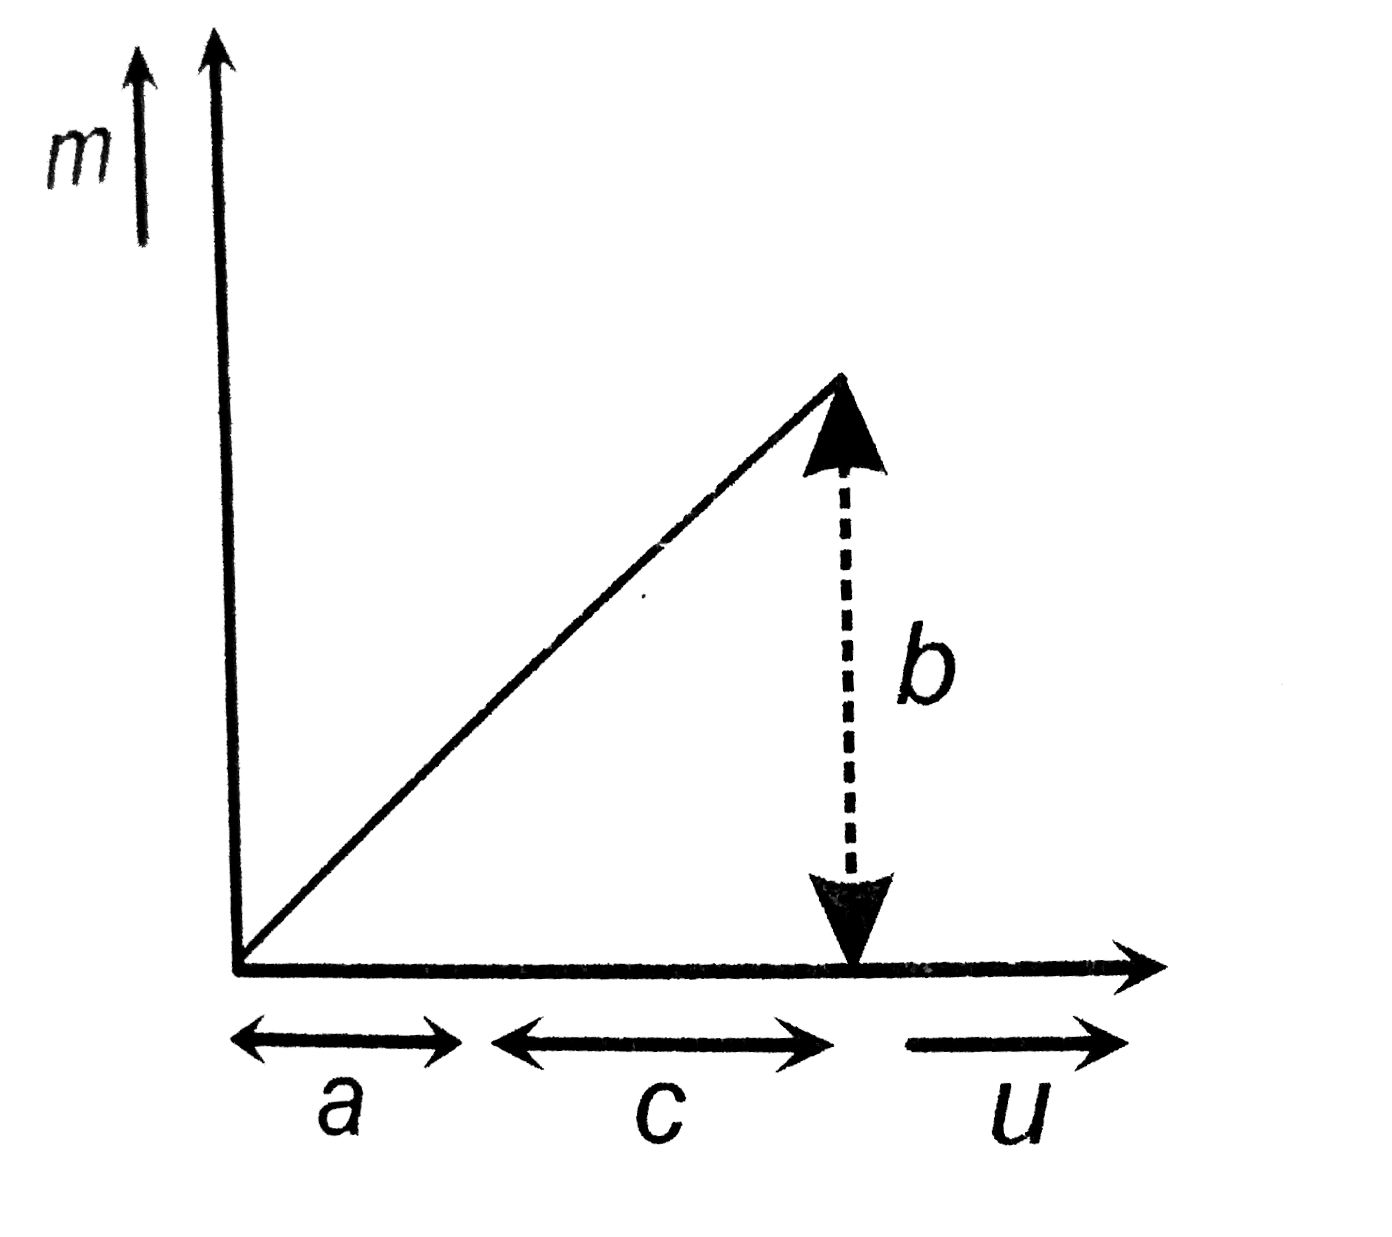 AbcBbcaCbcaDcb
Study the following graph which shows the production (in thousands)of different items, and answer these questions.
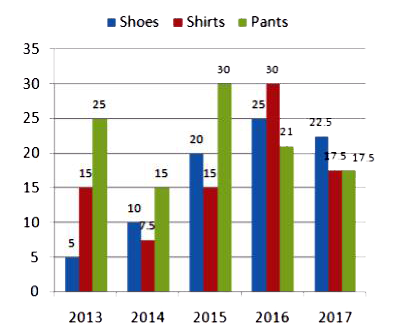
The ratio between the number of pants produced by the company in the year 2014, 2015 and 2016 respectively is:
View SolutionStudy the following graph which shows the production (in thousands) of different items, and answer these questions.
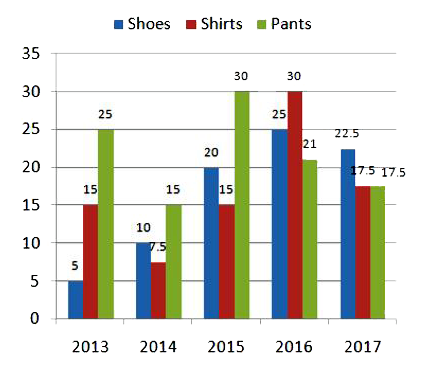
The total number of all products produced by the company in the year 2014 and 2016 together is:
View SolutionThe table shows the production of different types of cars ( in thousands).

The average production of cars in 2018 is approximately what percent less than the total production of type D cars in 2015 and type B cars in 2017 taken together ?
View SolutionStudy the following graph which shows the production (in thousand) of different items, and answer the questions.
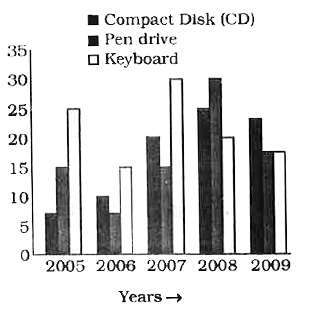
The total number of all products produced by the company in the year 2006 and 2008 together is
View SolutionIf p be the length of the perpendicular from the origin on the straight line x+2by=2p, then what is the value of b ?
View Solution
