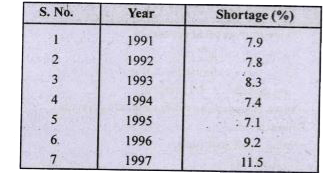
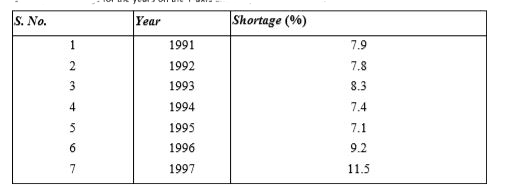
The following table shows the total power shortage in India from 1991-1997. Show the data in the form of a graph.
Plot shortage percentage for the years on the Y-axis and the year on the X-axis
The following Reaction are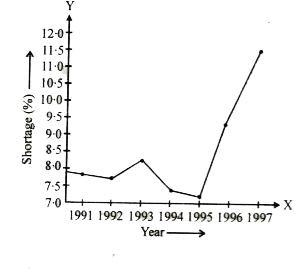
Similar Questions
The following Table shows the total power shortage in India from 1991 - 1997. Show the data in the form of a graph. Plot shortage percentage for the years on the Y-axis and the year on the X-axis
View SolutionThe given table shows the quantity of petrol and its cost.

Plot a graph to show the data.
View Solution
Knowledge Check
The following graph shows the profit ( in crore ₹) earned by a company in the years from 2012 to 2019.
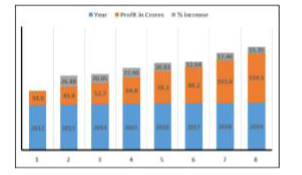
The percentage increased in the profit from the previous year , is greatest in the year :A2013B2017C2015D2018Study the following table carefully and answer the following question
The following graph shows information about the pass percentage of SSC students from the village XYX for the last 10 years.
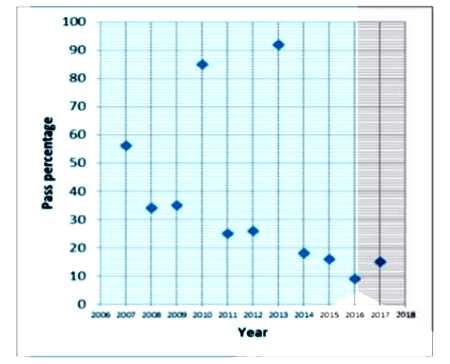
What is the pass percentage of SSC students from the village XYX in the year 2012 ?A96%B26%C59%D6%Study the following graph carefully and answer the given questions :-
The following graph shows the % profit of two companies over the years :-
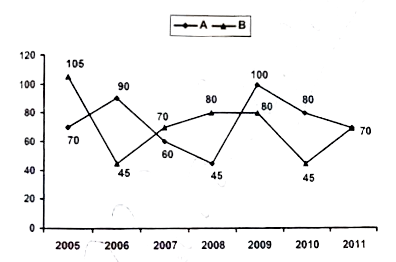
In which of the following years was the total income more than double the total expenditure in that year for company A ?A2010B2009C2006Dnone of these
. The following data shows the year wise strength of a school.Represent the the above data by bar graph:
View SolutionThe following table shows the estimated sectoral real growth rates (percentage change over the previous year) in GDP at factor cost.
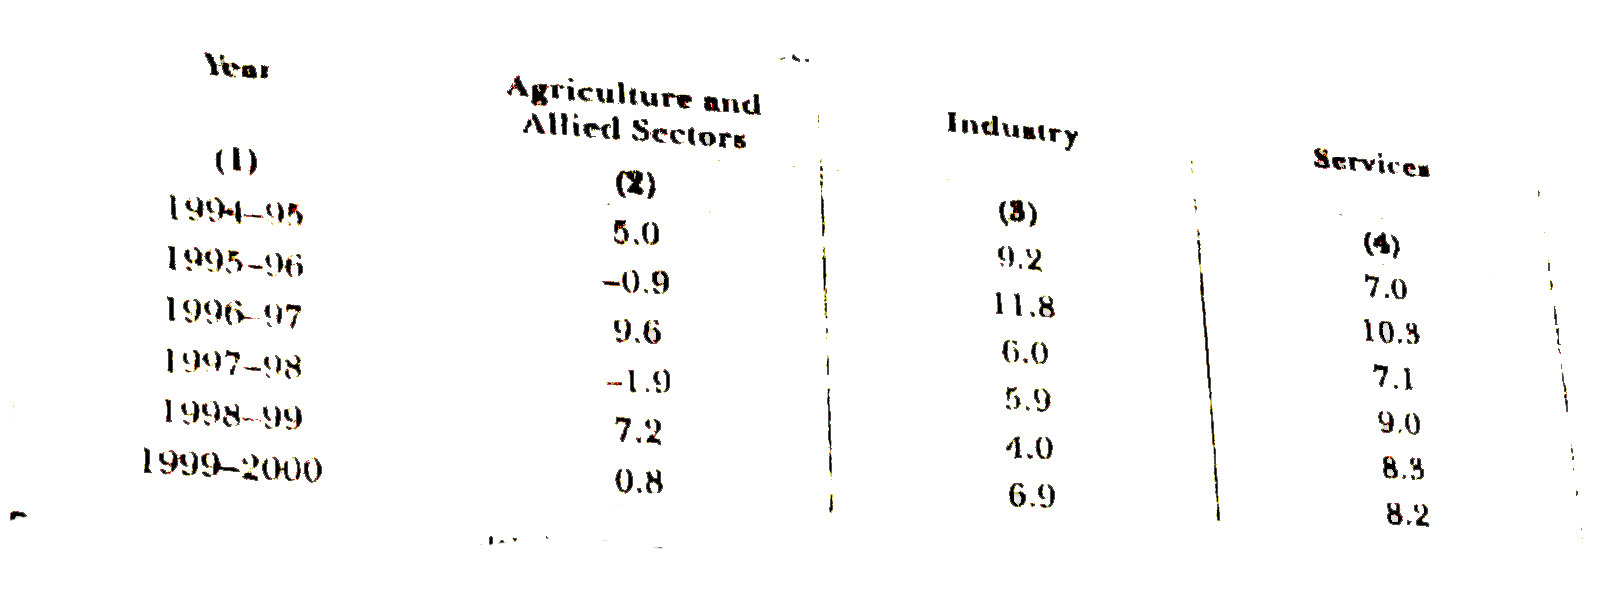
Represent the data as multiple time series graph.
View SolutionThe line graph shows the production of product A and B during the period 2004 to 2009 and the second line graph shows the percentage sale of these products
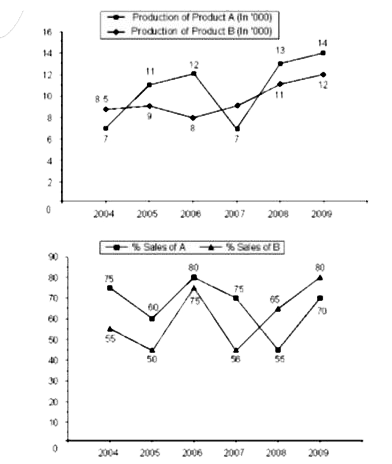
In the given line graph, what is the total sale of products A and B in the year 2007
View SolutionThe table given below shows number of literate people and total population in a village from the year 2011 to 2016 .
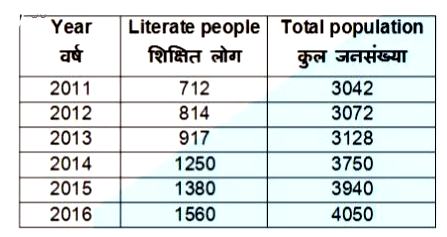
What is the percentage increase in the literate people in the year 2015 in comparison to year 2014?
View SolutionThe table given below shows number of literate people and total population in a village from the year 2011 to 2016.

What is the percentage increase in the literate people in the year 2015 in comparison to year 2014?
View Solution
