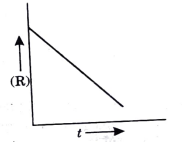
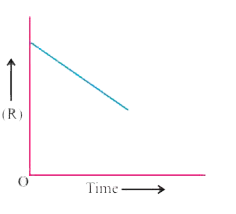
For a chemical reaction R→P the variation in the concentration (R) vs. time (t) plot is given as

Predict the order of the reaction. Solution in Punjabi
Step by step video & image solution for For a chemical reaction R rarr P the variation in the concentration (R) vs. time (t) plot is given as Predict the order of the reaction. by Chemistry experts to help you in doubts & scoring excellent marks in Class 12 exams.
Updated on:21/07/2023Topper's Solved these Questions
- CHEMICAL KINETICSBOOK - MODERN PUBLICATIONCHAPTER - CHEMICAL KINETICSEXERCISE - EXERCISE
531 Videos
- BIOMOLECULESBOOK - MODERN PUBLICATIONCHAPTER - BIOMOLECULESEXERCISE - EXERCISE
503 Videos
- CHEMISTRY IN EVERYDAY LIFEBOOK - MODERN PUBLICATIONCHAPTER - CHEMISTRY IN EVERYDAY LIFEEXERCISE - EXERCISE
352 Videos
Similar Questions
How can we express the rates of following reactions in terms of concentration of reactants and products ?
2O3↔3O2
View SolutionComplete the following statement- Uses for solder are-
View SolutionTrue or False : Equanil, used as tranquilizer, is a derivative of barbituric acid.
View SolutionFor chemical reaction R rarr P the variation in the concentration (R ) vs .Time (t) plot given as (i) predict the order of the reaction (ii) what is he slope of the curve?
View SolutionFor a chemical reactin R → P, variation of concentration of R vs time plot is given below : For this reaction :
(i) Predict the order of reaction.
(ii) What is the unit of rate constant (k) ?
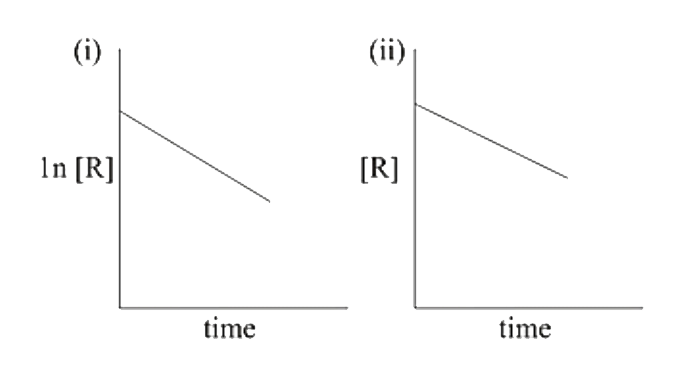
View SolutionThe given plots represent the variation of the concentration of a reactant R with time for different reactions (i) and (ii). The sum of orders of the reactions is ________ .
View SolutionThe given plots represent the variation of the concentration of a reactant R with time for different reactions (i) and (ii). The respective orders of the reactions are:
View SolutionThe given plots represent the variation of the concentration of a reactant R with time for two different reaction (i) and (ii) The respective orders of the reactions are

View SolutionFor a chemical reaction R to P, the variation in the concentration (R) vs time (t) plot is given : Predict the order of reaction.
View SolutionFor a chemical reaction R to P, the variation in the concentration (R) vs time (t) plot is given : Write down its rate law.
View SolutionFor a chemical reaction R → P, the variation in the concentration (R) vs time (t) plot is given :

What is the slope of the curve ?
View SolutionFor chemical reaction R rarr P the variation in the concentration (R ) vs .Time (t) plot given as (i) predict the order of the reaction (ii) what is he slope of the curve?
View SolutionFor a chemical reactin R → P, variation of concentration of R vs time plot is given below : For this reaction :
(i) Predict the order of reaction.
(ii) What is the unit of rate constant (k) ?
View SolutionFor a chemical reaction variation in concentraction, ln[R] vs. time (min) plot is shown below : What is the order of the reaction?
View SolutionFor a chemical reaction variation in concentraction, ln[R] vs. time (min) plot is shown below :

Draw the plot of log[R]∘R vs. time(s).
View SolutionThe given plots represent the variation of the concentration of a reactant R with time for different reactions (i) and (ii). The sum of orders of the reactions is ________ .
View Solution
