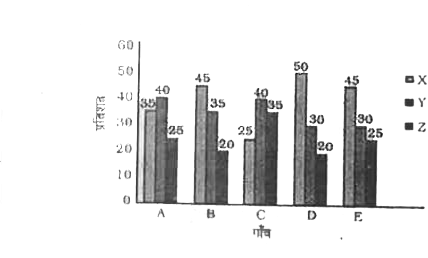
दिया गया स्तंभ आरेख (बार ग्राफ) क्रमश: 5000,6000,8000, 4500 और 6000 की कुल जनसंख्या वाले पाँच अलग-अलग गाँवो A,B,C,D ओर E में आयु समूहों X (5 वर्ष से अधिक) Y (20-50 वर्ष) Z (20 वर्ष से कम ), में जनसंख्या की प्रतिशतता को दर्शाता है।

गाँव B और C में सम्मिलित रूप से 20 वर्ष से कम आयु वाले व्यक्तियों की संख्या इन्ही गाँवो की कुल जनसंख्या का कितना प्रतिशत है ?
1907
1865
2007
1845
The correct Answer is:C
Step by step video & image solution for दिया गया स्तंभ आरेख (बार ग्राफ) क्रमश: 5000,6000,8000, 4500 और 6000 की कुल जनसंख्या वाले पाँच अलग-अलग गाँवो A,B,C,D ओर E में आयु समूहों X (5 वर्ष से अधिक) Y (20-50 वर्ष) Z (20 वर्ष से कम ), में जनसंख्या की प्रतिशतता को दर्शाता है। गाँव B और C में सम्मिलित रूप से 20 वर्ष से कम आयु वाले व्यक्तियों की संख्या इन्ही गाँवो की कुल जनसंख्या का कितना प्रतिशत है ? by Maths experts to help you in doubts & scoring excellent marks in Class 14 exams.
Updated on:21/07/2023Similar Questions
The given Bar Graph presents the number of students of two schools for six years. दिया गया दंड आरेख छः वर्ष की अवधि में दो विद्यालयों में छात्रों की संख्या को दर्शाता है | In which year, the percentage increase in students in school B is the highest in comparison to its previous year? किस वर्ष में, विद्यालय B में छात्रों की संख्या में प्रतिशत वृद्धि इसके पिछले वर्ष की तुलना में सबसे अधिक रही है?
View SolutionThe given Bar Graph presents the number of students of two schools for six years. दिया गया दंड आरेख छः वर्ष की अवधि में दो विद्यालयों में छात्रों की संख्या को दर्शाता है | In which year, the percentage increase of students in school A is the highest in comparison to its previous year? किस वर्ष, विद्यालय A में छात्रों की संख्या में प्रतिशत वृद्धि पिछले वर्ष की तुलना में सर्वाधिक है ?
View SolutionThe given Bar Graph presents the percentages of population in the age groups. X(above 50 years), Y(20 to 50 years). Z(below 20 years) in five different villages. A,B,C,D and E with total population of 5000, 6000, 8000, 4500 and 6000 respectively दिया गया दंड आरेख पांच गाँवों - A, B, C, D और E, जिनकी कुल आबादी क्रमशः 5000, 6000, 8000, 4500 और 6000 है, वहां आबादी के प्रतिशत को आयु वर्गों में प्रस्तुत करता है : X (50 वर्ष से अधिक ), Y (20 से 50 वर्ष ), Z (20 वर्ष से कम ) what is the total number of persons in the age group of 20 to 50 years in the villages A and B, taken together? गाँव A तथा B को मिलाकर 20 से 50 वर्ष के आयु वर्ग में लोगों की संख्या कुल कितनी है ?
View SolutionThe given Bar Graph presents the percentages of population in the age groups. X(above 50 years), Y(20 to 50 years). Z(below 20 years) in five different villages. A,B,C,D and E with total population of 5000, 6000, 8000, 4500 and 6000 respectively दिया गया दंड आरेख पांच गाँवों - A, B, C, D और E, जिनकी कुल आबादी क्रमशः 5000, 6000, 8000, 4500 और 6000 है, वहां आबादी के प्रतिशत को आयु वर्गों में प्रस्तुत करता है : X (50 वर्ष से अधिक ), Y (20 से 50 वर्ष ), Z (20 वर्ष से कम ) What is the ratio of the total number of persons of ages above 50 years in the villages, B and C, taken together to the total number of persons having ages between 20 and 50 years in the said villages? B और C गाँवों को मिलाकर 50 वर्ष से अधिक उम्र वाले व्यक्तियों की कुल संख्या का इन गाँवों में 20 से 50 वर्ष की आयु के व्यक्तियों की कुल संख्या के साथ अनुपात ज्ञात करें |
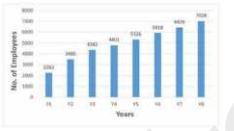
View SolutionThe Bar graph shown below presents the number of employees in an office during eight consecutive years.
नीचे दिया गया दंड आरेख किसी कार्यालय में आठ लगातार वर्षों के दौरान कर्मचारियों की संख्या को दर्शाता है |
The number of employees in year Y2 is how much percent less than the average number of employees per year?
वर्ष Y2 में कर्मचारियों की संख्या प्रति वर्ष कर्मचारियों की औसत संख्या से कितना प्रतिशत कम है ?
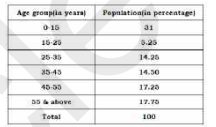
View SolutionThe following table showing the percentage of the total population of a state in different age groups. Out of every 50,000 people, find the approximate number of persons below the age of 35?
निम्नलिखित तालिका एक राज्य में अलग-अलग आयु वर्ग की कुल आबादी के प्रतिशत को दर्शाती है |
प्रत्येक 50,000 लोगों में से, 35 वर्ष से कम उम्र के लोगों की संख्या (लगभग) ज्ञात करें |
View SolutionThe given Bar Graph presents Income and Expenditure (in crores of Rupees) of a company for five years, 2014 to 2018. In which year is the Expenditure more than 40% as compared to the Expenditure in the previous year? दिया गया दंड आरेख (बार ग्राफ) 5 वर्षो, 2014 से 2018 के दौरान किसी कंपनी की आय और व्यय (करोड़ रुपए में) को दर्शाता है| पिछले वर्ष के व्यय की तुलना में किस वर्ष में वह 40% अधिक है?
View SolutionThe given Bar Graph presents the number of students of two schools for six years. दिया गया दंड आरेख (बार ग्राफ) छह वर्षो के दौरान दो स्कूलों में विद्यार्थियों की संख्या को दर्शाता है| In which year, the percentage increase in students in school B is the highest in comparison to its previous year? किस वर्ष में, स्कूल B के विद्यार्थियों की संख्या में प्रतिशत वृद्धि इसके पिछले वर्ष की तुलना में सबसे अधिक है?
View Solution
