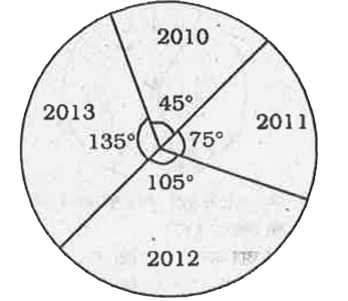
यहाँ दिए गए पाई-चार्ट में वर्ष और में सोने की कीमत दर्शयी गई है |

वर्ष 2011 की अपेक्षा वर्ष 2012 में एवं 2012 की अपेक्षा वर्ष 2013 में सोने की कीमतों में हुई प्रतिशत वृद्धि का अनुपात क्या होगा ?
6:5
7:5
8:5
9:5
The correct Answer is:B
Step by step video & image solution for यहाँ दिए गए पाई-चार्ट में वर्ष और में सोने की कीमत दर्शयी गई है | वर्ष 2011 की अपेक्षा वर्ष 2012 में एवं 2012 की अपेक्षा वर्ष 2013 में सोने की कीमतों में हुई प्रतिशत वृद्धि का अनुपात क्या होगा ? by Maths experts to help you in doubts & scoring excellent marks in Class 14 exams.
Similar Questions
The given Bar Graph presents the number of students of two schools for six years. दिया गया दंड आरेख छः वर्ष की अवधि में दो विद्यालयों में छात्रों की संख्या को दर्शाता है | In which year, the percentage increase in students in school B is the highest in comparison to its previous year? किस वर्ष में, विद्यालय B में छात्रों की संख्या में प्रतिशत वृद्धि इसके पिछले वर्ष की तुलना में सबसे अधिक रही है?
02:31View SolutionThe given Bar Graph presents the number of students of two schools for six years. दिया गया दंड आरेख छः वर्ष की अवधि में दो विद्यालयों में छात्रों की संख्या को दर्शाता है | In which year, the percentage increase of students in school A is the highest in comparison to its previous year? किस वर्ष, विद्यालय A में छात्रों की संख्या में प्रतिशत वृद्धि पिछले वर्ष की तुलना में सर्वाधिक है ?
02:57View SolutionThe given Bar Graph presents the number of students of two schools for six years. दिया गया दंड आरेख छः वर्ष की अवधि में दो विद्यालयों में छात्रों की संख्या को दर्शाता है | What is the ratio of the number of students taken together for the years 2008, 2012 and 2013 in School A to the number of students taken together for the years 2008, 2012 and 2013 in school B? विद्यालय A में 2008, 2012 तथा 2013 को मिलाकर छात्रों की संख्या का विद्यालय B में 2008, 2012 तथा 2013 को मिलाकर होने वाले छात्रों की संख्या के साथ अनुपात ज्ञात करें |
01:54View SolutionStudy the given chart carefully and answer the question accordingly:
दिए गए चार्ट का ध्यानपूर्वक अध्ययन करें और उसके अनुसार प्रश्न का उत्तर दें: In which of the following years was the percentage increase in production from the previous year, the maximum among the given years?
पिछले वर्ष की तुलना में निम्नलिखित वर्षों में से किस वर्ष में उत्पादन में अधिकतम प्रतिशत वृद्धि हुई?02:12View SolutionStudy the chart and answer the questions:
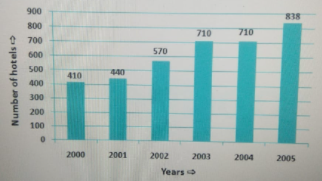
In which of the given years is the percentage increase in the number of hotels in comparison to the previous year, is the maximum?
चार्ट का अध्ययन करें और प्रश्नों का उत्तर दें:पिछले वर्ष की तुलना में होटलों की संख्या में किस वर्ष में अधिकतम प्रतिशत वृद्धि हुई है?03:22View SolutionThe given Bar Graph presents the number of students of two schools for six years. दिया गया दंड आरेख (बार ग्राफ) छह वर्षो के दौरान दो स्कूलों में विद्यार्थियों की संख्या को दर्शाता है| In which year, percentage increase of students in school A is the highest in comparison to its previous year ? किस वर्ष में, स्कूल A की विद्याथियों की संख्या में प्रतिशत वृद्धि इसके पिछले वर्ष की तुलना में सबसे अधिक है?
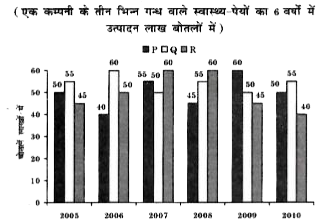
03:33View SolutionWhat was the approximate decline in the prodcution of flavour R in 2010 as compared to the production of 2008 in percentage?
वर्ष 2008 की तुलना में वर्ष 2010 में गन्ध R के उत्पादन में कितने प्रतिशत की कमी आई थी?
 01:21View Solution
The percentage of the total production of flavour R in 2007 and 2008 with respect to the production of flavour P in 2005 and 2006 is : वर्ष 2007 तथा 2008 में गन्ध R का कुल उत्पादन, वर्ष 2005 तथा 2006 में गन्ध P के उत्पादन की तुलना में कितने प्रतिशत रहा है?
02:05View Solution

