राजस्व व्यय और पूँजीगत व्यय में भेद कीजिए।
Step by step video & image solution for राजस्व व्यय और पूँजीगत व्यय में भेद कीजिए। by Economics experts to help you in doubts & scoring excellent marks in Class 12 exams.
Updated on:21/07/2023Topper's Solved these Questions
Similar Questions
उत्पादन के चार कारक कौन-कौन से हैं और इनमें से प्रत्येक के पारिश्रमिक को क्या कहते हैं?
View Solutionवसंत - आश्रम का अनुमानित व्यय | लेख | आश्रम का अनुमानित व्यय भाग -1
View Solutionवसंत - आश्रम का अनुमानित व्यय | लेख | आश्रम का अनुमानित व्यय भाग -2
View SolutionA cell whose internal resistance is r is connected to a load resistance R. Energy is spent in the load but some heat energy is wasted in the cell. Efficiency of this system eta=("लोड में व्यय ऊर्जा")/("पूरे परिपथ में व्यय ऊर्जा") Receive from The efficiency of this system is given by which of the following
View SolutionActing income Rs 5000 प्रतिमाह है। वह 3000 रुपये प्रतिमाह व्यय कर देता है। अनुपात ज्ञात कीजिए। अभिनव की व्यय और बचत में।
View SolutionIncomes of A and B are in the ratio of 5 : 3 and their expenditures are in the ratio of 9 : 5. If the income of B is equal to the expenditure of A, then what is the ratio of the savings of A and B?
View SolutionThe ratio of incomes of A and B is 3:8 and the ratio of their savings is 9:25. If the income of A equals the expenditure of B, then the ratio of expenditures of A and B is:
A और B की आय में 3 : 8 का अनुपात है तथा उनकी बचत में 9 :25 का अनुपात है | यदि A की आय B के व्यय के बराबर है, तो A और B के व्यय में क्या अनुपात है ?
View SolutionThe given Bar Graph presents Income and Expenditure (in crores of Rupees) of a company for the five years, 2014 to 2018. दिया गया दंड आरेख पांच वर्षों अर्थात 2014 से 2018 तक एक कंपनी के आय एवं व्यय ( करोड़ रुपये में ) को दर्शाता है | In which year is the Expenditure more than 40% as compared to the Expenditure in the previous year? किस वर्ष में व्यय पिछले वर्ष के व्यय की तुलना में 40% अधिक है ?
View SolutionThe given Bar Graph presents Income and Expenditure (in crores of Rupees) of a company for the five years, 2014 to 2018. दिया गया दंड आरेख पांच वर्षों अर्थात 2014 से 2018 तक एक कंपनी के आय एवं व्यय ( करोड़ रुपये में ) को दर्शाता है | What is the ratio of total Expenditure to total Income of the company in 2014, 2016 and 2017? 2014, 2016 और 2017 में कंपनी के कुल व्यय और कुल आय में क्या अनुपात है ?
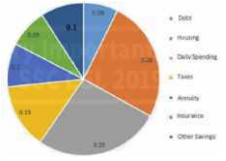
View SolutionThe Pie-chart given below shows the figures of various heads of expenditure incurred by Anurag in a year. In how many heads is his expenditure less than the expenditure he incurred on tax?
नीचे दिया गया वृत्त आरेख अनुराग द्वारा किसी वर्ष में किए गए व्यय के विभिन्न शीर्षों के आंकड़ों को दर्शाता है | उसके द्वारा टैक्स पर किए गए व्यय की तुलना में कितने शीर्षों में उसके व्यय कम हैं ?
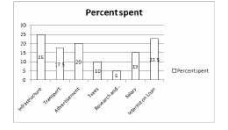
View SolutionThe given graph represents the percentage distribution of the total expenditure of a company. Study the graph and answer the question that follows.
दिया गया आरेख एक कंपनी के कुल व्यय के प्रतिशत वितरण को दर्शाता है। आरेख का अध्ययन कीजिए और फिर पूछे गए प्रश्न का उत्तर दीजिए। What is the ratio of the total expenditure on .Infrastructure. and .Transport. to the total expenditure on .Taxes. and .Interest on Loans.?
‘आधारभूत संरचना’(Infrastructure) तथा “परिवहन. (Transport) पर किये गए कुल व्यय और “करों (Taxes) तथा “ऋण पर ब्याज.(Interest on loans) पर किये गए कुल व्यय के बीच अनुपात ज्ञात कीजिए।
View SolutionStudy the given graph and answer the questions that follow.
दिए गए आरेख का अध्ययन करें और उन सवालों के जवाब दें, जो अनुसरण करते हैं।
The total revenue in 2015 and 2017 is what percent of the total expenditure of the company in 2016, 2018 and 2019 (correct to one decimal place) ?
2015 और 2017 में कुल राजस्व 2016, 2018 और 2019 में कंपनी के कुल व्यय का कितना प्रतिशत है (एक दशमलव स्थान तक )?
View Solution'दुर्घटना क्यों और कैसे हुई', वाक्य में प्रयुक्त क्रिया-विशेषण का भेद इंगित कीजिए
View SolutionThe given Bar Graph presents Income and Expenditure (in crores of Rupees) of a company for five years, 2014 to 2018. What is the ratio of total Expenditure to total Income of the company in 2014,2016 and 2017? दिया गया दंड आरेख (बार ग्राफ) 5 वर्षों, 2014 से 2018 के दौरान किसी कंपनी की आय और व्यय (करोड़ रुपए में) को दर्शाता है| 2014, 2016 और 2017 में कंपनी के कुल व्यय और कुल आय का अनुपात क्या है?
View SolutionThe given Bar Graph presents the Revenue and Expenditure (in crores of Rupees ) of a company during the five year period , 2014 - 2018. दिया गया दंड आरेख (bar graph) 5 वर्ष की अवधि 2014-2018 के दौरान किसी कंपनी के राजस्व और व्यय (करोड़ रुपए में ) को दर्शाता है। The expenditure of the company in 2017 is what percentage less than the average revenue ( per year ) in 2014, 2015 and 2016 ? वर्ष 2017 में कंपनी का व्यय, वर्ष 2014, 2015 और 2016 में औसत राजस्व (प्रति वर्ष) से कितने प्रतिशत कम है?
View SolutionThe given Bar Graph presents the Revenue of Expenditure (in crores of rupees) of a company during the five year period, 2014 - 2018. दिया गया दंड आरेख (Bar graph) 5 वर्ष की अवधि 2014-2018 के दौरान किसी कंपनी के राजस्व और व्यय (करोड़ रुपए में) को दर्शाता है| वर्ष 2016 से 2018 तक कंपनी का कुल व्यय, 5 वर्ष की अवधि के कुल राजस्व का कितना प्रतिशत )पूर्णांक के करीब है)? The total expenditure of the company from 2016 - 2018 is what percentage (nearest to an integer) of the total revenue of the five year period?
View Solution
