Direction :- Study the graph and answer the questions.
Demand and Production of Colour TV Sets of Five companies A,B,C,D and E for October 2006
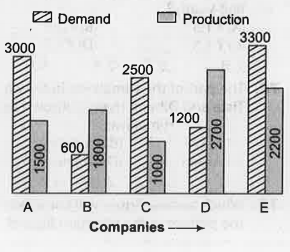
The average production of the companies A,B,C and that of the companies D,E are in the ratio
(A) (B) (C) (D)
B
C
A
D
Step by step video & image solution for Direction :- Study the graph and answer the questions. Demand and Production of Colour TV Sets of Five companies A,B,C,D and E for October 2006 The average production of the companies A,B,C and that of the companies D,E are in the ratio (A) 85 : 147 (B) 86 : 147 (C) 86 : 149 (D) 87 : 149 by Maths experts to help you in doubts & scoring excellent marks in Class 14 exams.
Similar Questions
Direction :- Study the graph and answer the questions.
Demand and Production of Colour TV Sets of Five companies A,B,C,D and E for October 2006
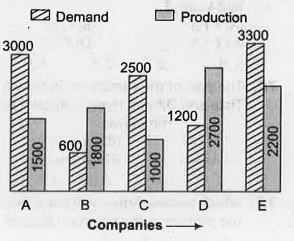
What per cent of the demand of company C is that of the company B?
(A) 14% (B) 20% (C) 24% (D) 26%View SolutionStudy the following graph carefully and answer the question given below it.
Production and sale of printers of various companies in a month.
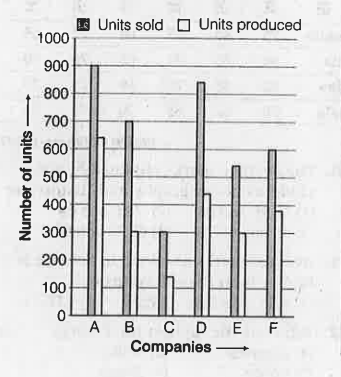
The total produced by the companies A B and C together isView Solution
Knowledge Check
- Question 1 - Select One
What is the ratio of average demand to average production of companies B and D?
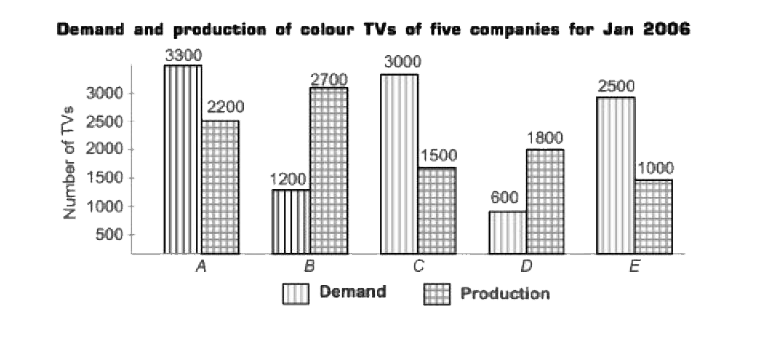 A1:5B2:5C3:5D4:5
 - Question 2 - Select One
The given bar graph Presents the Demand and Production of motorcycle of five companies
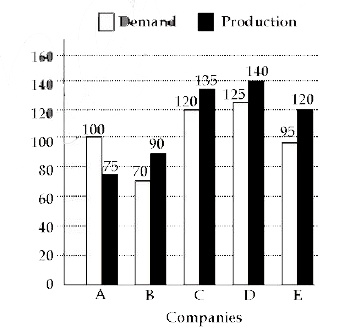
The average Production of motorcycles of companies B,C and E taken together is what percentage less than the Demand of motorcycles of D?A0.08B0.087C0.093D0.06 - Question 3 - Select One
Study the following graph carefully and answer the questions -----
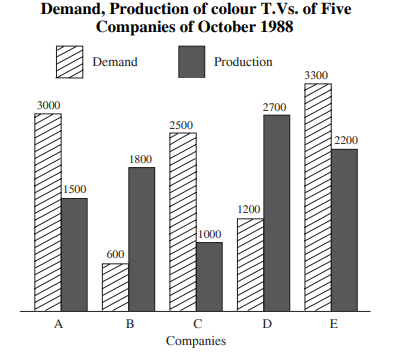
The production of company D is approximately how many times that of the production of the company A ?A1.8B1.5C2.5D1.11
Study the following bar graph and answer the question given
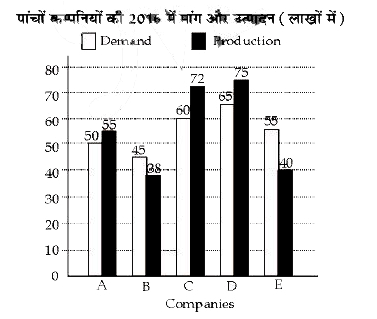
The ratio of the total demand of motorcycles of companies A,C and E to the total production of motorcycles of B and C is:View SolutionStudy the graph and answer the question
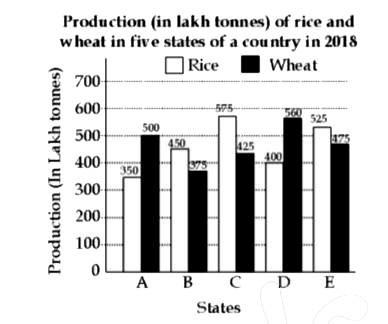
Total production of wheat in states A , B and E is what percentage less than the total production of rice in states C, D and E?View SolutionStudy the following bar graph and answer the question given.
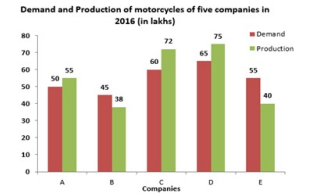 The total production of motorcycles of companies C, D and E is what per cent less than the total demand of motor cycles of all the companies during five years?View Solution
The following graph shows the demand and production of cotton by 5 companies A, B, C, D and E. Study the graph and answer question
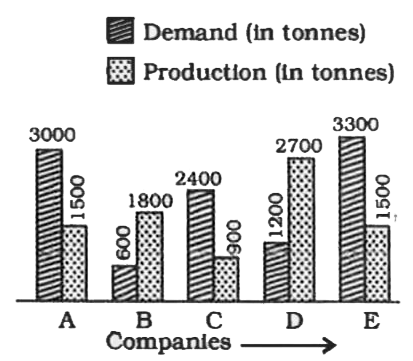
The production of company D is how many times that of the production of the company A?View SolutionStudy the following bar diagram carefully and answer the four questions.
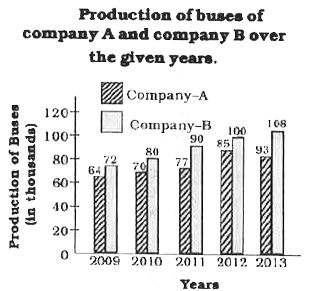
The ratio of the average production of company A in 2009 and 2010 to the average production of company B in the same years isView Solution

