Following bar graph shown the income and expenditure ( in Rs. lakhs) of a ceremony. Read the graph carefully and answer the questions.
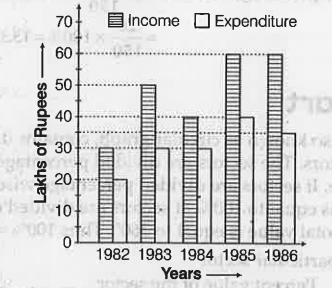
What is the average income of the company are the years?
Rs. 24 lakhs
Rs. 36 lakhs
Rs. 48 lakhs
Rs. 52 lakhs
Step by step video & image solution for Following bar graph shown the income and expenditure ( in Rs. lakhs) of a ceremony. Read the graph carefully and answer the questions. What is the average income of the company are the years? by Maths experts to help you in doubts & scoring excellent marks in Class 14 exams.
Updated on:21/07/2023Similar Questions
Following bar graph shown the income and expenditure ( in Rs. lakhs) of a ceremony. Read the graph carefully and answer the questions.
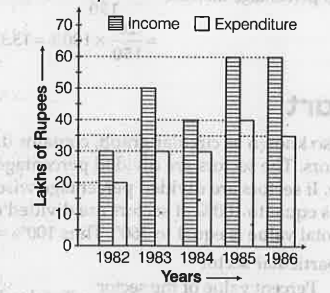
Which of the following pairs of years, shows the equal expenditure of the company?
View SolutionRead the following graph carefully and answer the questions given below:
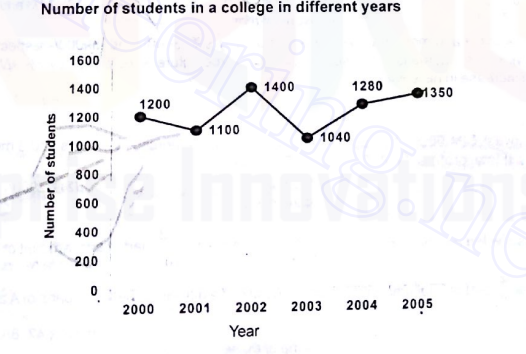
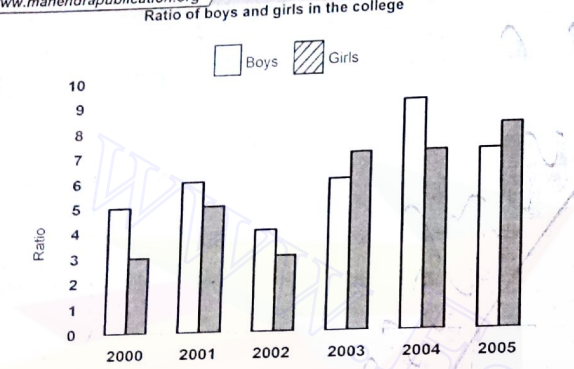
What is the average number of girls in all the years?
View Solution
Knowledge Check
Read the graph and answer the following questions.
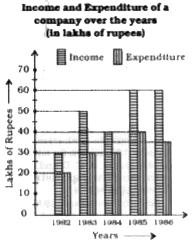
The ratio of the average income of all the years to the average profit isA24:13B48:17C12:7D6:5In the following questions, a graphical representation of income and expenditure of 5 persons during the month of January has been given. Read the graph and answer the questions.
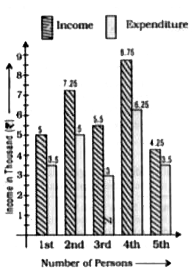
What is the average income of five persons per month ?ARs 5775BRs 6000CRs 6150DRs 6250Study the following graph which shows income and expenditure of a company over the years 2005 - 2009 and answer the questions.
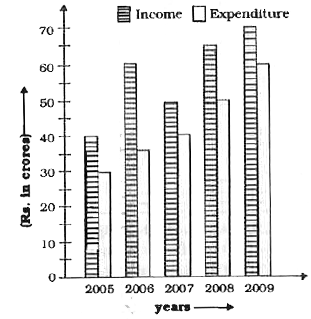
In how many years was the income of the company less than the average income of the given years ?A4B3C2D1
Following graph shows the income of a company in six different years. Study the graph , carefully and answer the questions that follow.
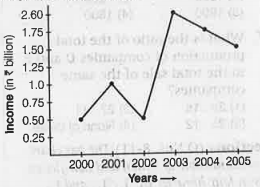
What is the ratio of the income of the company in the years 2000 and 2005 ?
View SolutionFollowing graph shows the income of a company in six different years. Study the graph , carefully and answer the questions that follow.
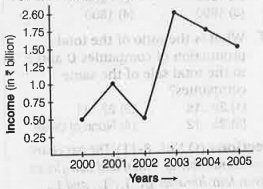
In which year income of the company is the highest?
View Solution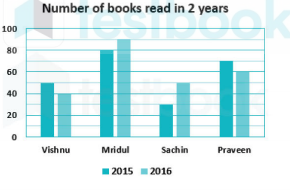
Directions: Read the bar graph carefully and answer the given questions.What is the average of total number of books read by all of them in the year 2016?
View SolutionThe graph shows Income and Expenditure of a company. Study the graph and answer the questions.
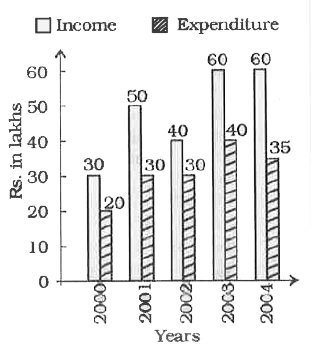
The number of years in which the income exceeds the average income is
View SolutionThe graph shows Income and Expenditure of a company. Study the graph and answer the questions.
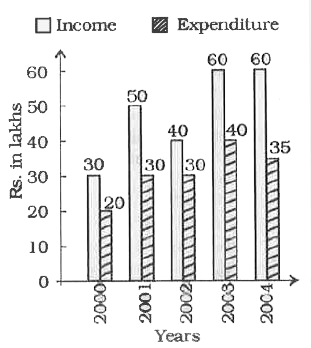
The profit was maximum in the year
View Solution
